Download

1 / 18
200 likes | 386 Vues
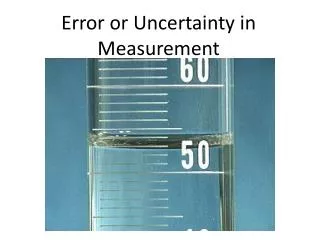
Uncertainty and Error in Measurement. Let’s Think…. You measure the temperature of a glass of water 10 times, using 10 different thermometers. Results in Celsius : 19.9, 20.3, 20.2, 20.0, 20.0, 20.1, 19.9, 20.3, 19.9, 20.2 How would you accurately report the final temperature?.

E N D
Let’s Think… You measure the temperature of a glass of water 10 times, using 10 different thermometers. Results in Celsius : 19.9, 20.3, 20.2, 20.0, 20.0, 20.1, 19.9, 20.3, 19.9, 20.2 How would you accurately report the final temperature?
Let’s Think… Answer the following questions related to the data collected. • Is it reasonable to assume that the actual temperature is about 20ᵒC? Why or why not? 2. If not, what would the reasonable result be? Actual result…. 20.08 20.1 20.1 +/- 0.2 ᵒC This result is both reasonable And precise!
Precision • Refers to how close several experimental measurements of the same quantity are to each other • In previous example: • If one student took all the temp. readings, they would be said to be repeatable, whereas if several students had taken the readings they would be said to be reproducible.
Accuracy • How close a precise reading is to the true reading (literature value) • If all thermometers are reading 20ᵒC when the true value of the temp is 19ᵒC, then they are giving precise but inaccurate readings • This is due to systematic errors • Due to the apparatus itself, or due to the way in which the readings are taken
Random Error • Occur if there is an equal probability of the reading being high or low from one measurement to the next • Might include variations in the volume of the glassware due to temp fluctuations, or the decision on ten an indicator changes color during and acid base titration
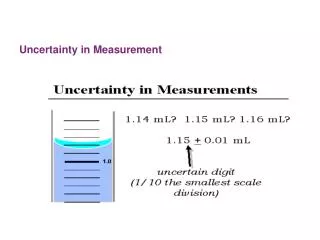
Significant Figures • Significant figures are critical when reporting scientific data because they give the reader an idea of how well you could actually measure/report your data.
Significant Figures Four Main Rules • All non zero numbers are ALWAYS significant ex) 125, 34, 971 • Leading zeros are NOT significant. They indicate the position of the decimal ex) 0.0025 , 0.01, 0.00347
3) Zeros that are sandwiched between non zero numbers are ALWAYS significant. ex) 103, 4009, 12.05 4) Trailing zeros at the right end of a number are significant ONLY if the number contains a decimal point ex) 100, 20 (1 sig fig) ex) 100. , 20.0 (three sig figs)
Addition and Subtraction • When adding or subtracting, it is the number of decimal places that is important. • When using a balance that measures +/-0.01 g, the answer can be quoted to two decimal places, which may increase or decrease the number of significant figures.
Addition and Subtraction • Example: 7.10 g + 3.10 g = 10.20 g 3 sig figs 3 sig figs 4 sig figs 22.36 g + 5.16 g = 7.20 g 4 sig figs 4 sig figs 3 sig figs
Multiplication and Division • When multiplying or dividing, it is the number of significant figures that is important. • The number with the fewest significant figures used in the calculation determines how many significant figures should be used when writing the answer
Multiplication and Division Examples 4.56 x 1.4 = 6.38 6.4 3 sig figs 2 sig figs 3 sig figs 2 sig figs 3.217 x 2.64 = 8.49288 8.49 4 sig figs 3 sig figs 6 sig figs 3 sig figs
Practice… • 1.20 + 2.35 = 3.6 • 32.0 – 27.0 = 5.0 • (6.3 + 2.2 ) – 3.9 = 4.6 • 6.2 x 7 = 43.4 40 • 46.12 / 13 = 3.54 3.5 • (2.3 x 4.00) / 1.7 = 5.41
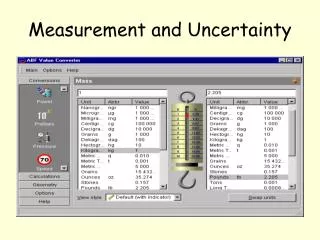
Uncertainties • It the degree of tolerance is not stated on an apparatus, you will have to estimate • Degree of tolerance, is where the manufacturer lists the uncertainty of the apparatus
If you are making a single measurement with a piece of apparatus, the absolute uncertainty & the percentage uncertainty can both be easily stated. • For example, Consider measuring 25.0 cm3 with a 25 cm3 pipette that measures to +/- 0.1 cm3 . The absolute uncertainty is 0.1 cm3 and the percentage uncertainty is equal to… 0.1 / 25.0 x 100 = 0.4%