Download
1 / 35
360 likes | 488 Vues
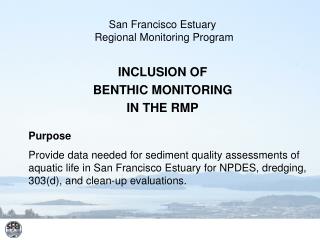
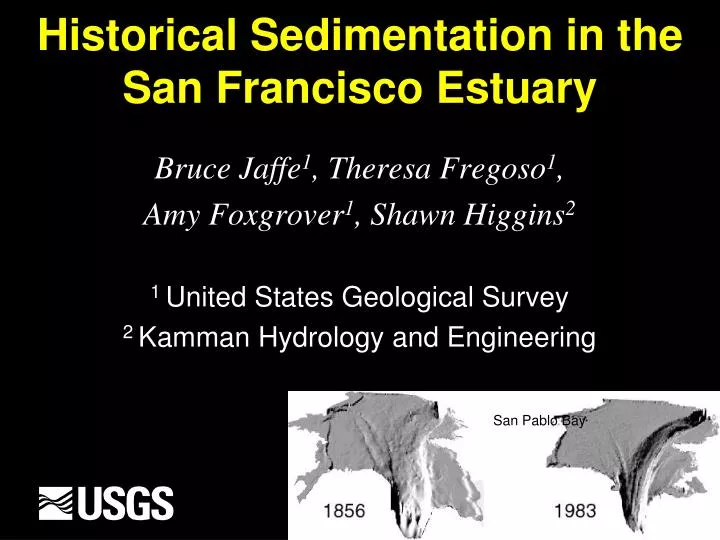
Historical Sedimentation in the San Francisco Estuary. Bruce Jaffe 1 , Theresa Fregoso 1 , Amy Foxgrover 1 , Shawn Higgins 2 1 United States Geological Survey 2 Kamman Hydrology and Engineering. San Pablo Bay. Outline. The Estuary in the past 150 years

E N D
Historical Sedimentation in the San Francisco Estuary Bruce Jaffe1, Theresa Fregoso1, Amy Foxgrover1, Shawn Higgins2 1 United States Geological Survey 2 Kamman Hydrology and Engineering San Pablo Bay
Outline • The Estuary in the past 150 years • Sediment connectivity of sub-embayments • Sediment delivery control on tidal flat change
Outline • The Estuary in the past 150 years • Sediment connectivity of sub-embayments • Sediment delivery control on tidal flat change Jaffe et al., 1998; Capiella et al., 1999; Foxgrover et al., 2004; Jaffe and Foxgrover, 2006a; Jaffe and Foxgrover, 2006b; Jaffe et al., 2007; Fregoso et al., 2008; Jaffe, 2009
Outline • The Estuary in the past 150 years • Sediment connectivity of sub-embayments • Sediment delivery control on tidal flat change
The Data Image obtained from NOAA photo library (www.photolib.noaa.gov)
Generation of Bathymetric Models • Digitize soundings, contours, and marsh extent • Georeference data • Error checking • Generate 25 or 50m bathymetric grid using TopoGrid
San Francisco Estuary • in the 1980s • Area: ~1200 km2 • Average depth: 7 m • Median depth: 3 - 4 m • Deepest point: ~120 m • (Golden Gate)
The morphology of the estuary has changed 1890s 1920s 1850s 1950s 1980s
Generation of SedimentationGrids • Correct to a common vertical datum • Adjust for subsidence (as needed) • Difference the grids
Net sediment gain of ~250 million cubic meters from 1850s - 1980s San Pablo Bay Gain 339 Mcm Suisun Bay Loss 52 Mcm Central Bay Gain 71 Mcm ( loss of 48 Mcm from borrow areas) South Bay Loss 90 Mcm ( loss of 38 Mcm from borrow areas)
1850s to 1890s- gain of ~290 Mcm San Pablo Bay Mcm 300 Suisun Bay 200 100 0 Mcm -100 300 200 1850s to 1890s 1890s to 1920s 1920s to 1950s 1950s to 1980s 100 0 Central Bay Mcm -100 300 1850s to 1890s 1890s to 1920s 1920s to 1950s 1950s to 1980s 200 100 South Bay Mcm 0 300 -100 200 1850s to 1890s 1890s to 1950s 1950s to 1980s 100 0 -100 1850s to 1890s 1890s to 1920s 1920s to 1950s 1950s to 1980s Hydraulic mining
1890s to 1920s- loss of ~100 Mcm San Pablo Bay Mcm 300 Suisun Bay 200 100 0 Mcm -100 300 200 1850s to 1890s 1890s to 1920s 1920s to 1950s 1950s to 1980s 100 0 Central Bay Mcm -100 300 1850s to 1890s 1890s to 1920s 1920s to 1950s 1950s to 1980s 200 100 South Bay Mcm 0 300 -100 200 1850s to 1890s 1890s to 1950s 1950s to 1980s 100 0 -100 1850s to 1890s 1890s to 1920s 1920s to 1950s 1950s to 1980s After hydraulic mining
1920s to 1950s- gain of ~100 Mcm San Pablo Bay Mcm 300 Suisun Bay 200 100 0 Mcm -100 300 200 1850s to 1890s 1890s to 1920s 1920s to 1950s 1950s to 1980s 100 0 Central Bay Mcm -100 300 1850s to 1890s 1890s to 1920s 1920s to 1950s 1950s to 1980s 200 100 South Bay Mcm 0 300 -100 200 1850s to 1890s 1890s to 1950s 1950s to 1980s 100 0 -100 SF Bay Area population increase 1850s to 1890s 1890s to 1920s 1920s to 1950s 1950s to 1980s
1950s to 1980s- loss of ~200 Mcm San Pablo Bay Mcm 300 Suisun Bay 200 100 0 Mcm -100 300 200 1850s to 1890s 1890s to 1920s 1920s to 1950s 1950s to 1980s 100 0 Central Bay Mcm -100 300 1850s to 1890s 1890s to 1920s 1920s to 1950s 1950s to 1980s 200 100 South Bay Mcm 0 300 -100 200 1850s to 1890s 1890s to 1950s 1950s to 1980s 100 0 -100 1850s to 1890s 1890s to 1920s 1920s to 1950s 1950s to 1980s Water projects
From the 1850s-1980s Circular bays near the center of the Estuary bays (San Pablo and Central) had net deposition Elongate bays at ends of estuary (Suisun and South) had net erosion From 1950s-1980s All bayswere erosional Net Net
Question: Will the bays continue to erode? ? ? ? ?
Partial answer: Not necessarily…. South San Francisco Bay had net deposition from 1983 to 2005 No data for other bays ? ? ?
Outline • The Estuary in the past 150 years • Sediment connectivity of sub-embayments • Sediment delivery control on tidal flat change
Sediment Connectivity Sub-embayment #1 Sub-embayment #2 Sediment Exchange
Determining the degree of sediment connectivity • Modeling studies • Tracers (natural and anthropogenic) • Patterns and quantities of erosion and deposition
Determining the degree of sediment connectivity • Patterns and quantities of erosion and deposition • Similar behavior (erosion and deposition occur at sub-embayments at the same time) • Opposite behavior of subembayments with similar magnitude (sediment eroded from one sub-embayment transported and deposited in another embayment) • Quantity of deposition greater than local tributary supply (sediment coming from somewhere else)
South SF Bay example of similar behavior (inferred sediment connectivity) Net Net
Outline • The Estuary in the past 150 years • Sediment connectivity of sub-embayments • Sediment delivery control on tidal flat change
Tidal flats of the estuary have changed 1890s 1920s 1850s 1950s 1980s
Tidal flat area decrease >50% San Pablo Bay km2 100 80 60 40 20 Suisun Bay 0 km2 Central Bay km2 100 100 80 80 60 60 40 40 20 20 0 0 South Bay km2 100 80 1850s 60 1890s 40 20 1920s 0 1950s 1980s
Intertidal mudflat area responded to changes in sediment supply to San Pablo Bay
Mudflats widened where sediment was abundant Jaffe et al., 2007
Summary- Historical Sedimentation in the San Francisco Estuary • The estuary in the past 150 years • The patterns of gain and loss of sediment are complex • There were periods with net gain (e.g., hydraulic mining in mid-1800s) and periods with net loss (e.g., water projects in mid- to late 1900s) • Sediment connectivity of sub-embayments • Patterns and quantities of erosion and deposition point towards a connected system • Sediment supply controls on tidal flats • In San Pablo Bay, increased tidal flat area during the hydraulic mining period corresponded to increased sediment supply. Decrease in tidal flat area during the late 1900s corresponded with a decrease in sediment supply.
Sediment removal from 1950s to 1980s • Areas outlined in green are where sediment was removed > 50 Mcm of sediment removed from the system ~60% of sediment loss from Central Bay was from human activities
Marsh area decrease >90% 1850s Central Bay km2 1890s 1920s 1950s 1980s South Bay km2