Download
1 / 1
10 likes | 237 Vues
f is a lineshape factor, of FWHM , from the steady state solution to optical Bloch equations of a two-level atom in the weak-probe limit . See [3]. Measured at , where I sat is the saturation intensity [8]. Acknowledgements. This work is funded by EPSRC.

E N D
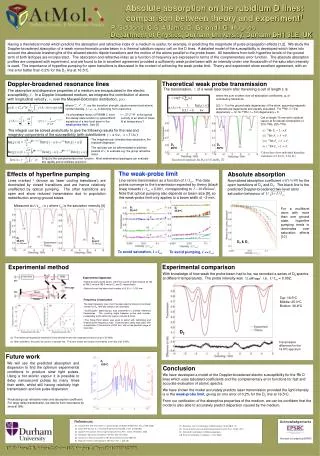
f is a lineshape factor, of FWHM , from the steady state solution to optical Bloch equations of a two-level atom in the weak-probe limit. See [3] Measured at , where Isat is the saturation intensity [8] Acknowledgements This work is funded by EPSRC Absolute absorption on the rubidium D lines: comparison between theory and experiment1 P. Siddons, C.S. Adams, C. Ge and I.G. Hughes Department of Physics, Durham University, Durham DH1 3LE, UK Having a theoretical model which predicts the absorption and refractive index of a medium is useful, for example, in predicting the magnitude of pulse propagation effects [1,2]. We study the Doppler-broadened absorption of a weak monochromatic probe beam in a thermal rubidium vapour cell on the D lines. A detailed model of the susceptibility is developed which takes into account the absolute linestrengths of the allowed electric dipole transitions and the motion of the atoms parallel to the probe beam. All transitions from both hyperfine levels of the ground term of both isotopes are incorporated. The absorption and refractive index as a function of frequency are expressed in terms of the complementary error function. The absolute absorption profiles are compared with experiment, and are found to be in excellent agreement provided a sufficiently weak probe beam with an intensity under one thousandth of the saturation intensity is used. The importance of hyperfine pumping for open transitions is discussed in the context of achieving the weak-probe limit. Theory and experiment show excellent agreement, with an rms error better than 0.2% for the D2 line at 16.5oC. Why rubidium and caesium? Doppler-broadened resonance lines Theoretical weak probe transmission The transmission, T, of a weak laser beam after traversing a cell of length L is The absorptive and dispersive properties of a medium are encapsulated in the electric susceptibility, . In a Doppler-broadened medium, we integrate the contribution of atoms with longitudinal velocity , v, over the Maxwell-Boltzmann distribution, g(v). where the sum is taken over all absorption coefficients, , of contributing transitions where are the transition strength, dipole moment and atomic number density. is detuning from resonance 2(2I + 1) is the ground state degeneracy of the atom, assuming magnetic sublevels are degenerate and equally populated. For 85Rb (I= 5/2) degeneracy = 12, for 87Rb (I = 3/2) degeneracy = 8 is the typical velocity of an atom of mass M at temperature T Cell of length 75 mm with rubidium vapour at its natural composition of 72% 85Rb, 28% 87Rb The integral can be solved analytically to give the following results for the real and imaginary components of the susceptibility (with substitutions , ) The imaginary part characterises absorption, the real part dispersion. The real part can be differentiated to arbitrary powers of y, to evaluate e.g. the group refractive index D2 20oC D1 30oC Colour lines show individual hyperfine transitions (12 for D2, 8 for D1) Erfc[z] is the complementary error function. Most mathematical packages can evaluate this rapidly and to arbitrary precision Transition frequencies for D2 [4,5,6] and D1 [7] Theweak-probe limit Effects of hyperfine pumping Absolute absorption Line-centre transmission as a function of I / Isat. The data points converge to the transmission expected by theory (black lines) towards I / Isat = 0.001, corresponding to . Note that optical pumping also depends on beam size [9], so this weak-probe limit only applies to a beam width of ~2 mm. Lines marked * (known as ‘laser cooling transitions’) are dominated by closed transitions and are hence relatively unaffected by optical pumping. The other transitions are open and show reduced transmission due to population redistribution among ground states Normalised absorption coefficient for the open transitions of D2 and D1. The black line is the predicted Doppler-broadened two-level atom saturation behaviour of For a multilevel atom with more than one ground state, hyperfine pumping tends to dominates over saturation effects [10] D2 25.4oC D1 35.6oC * * * D2 25.4oC D1 35.6oC D2 & D1 * To avoid saturation, I < Isat To avoid pumping, I << Isat Experimental method Experimental comparison With knowledge of how weak the probe beam had to be, we recorded a series of D2 spectra at different temperatures. The probe intensity was i.e. I / Isat = 0.002. • Experimental Apparatus • External cavity diode lasers were the source of light (Toptica DL100 at 780.2 nm and 795.0 nm for D2 and D1 respectively). • Before the cell the beam had a radius of (2.00 +/- 0.05) mm. Telescope Top: 16.5oC Middle: 25.0oC Bottom: 36.6oC Heater • Frequency Linearization • The laser frequency scan from the piezo-electric drivers is nonlinear (shown for D2, left) and needs to be calibrated. • Sub-Doppler spectroscopy was performed to provide reference frequencies. The crossing angle between probe and counter-propagating pump within the vapour cell was 6 mrad. • The Fabry-Perot etalon was used to assist with calibrating and linearizing the frequency scan. A plane-plane cavity was used, with a separation of the mirrors of 250 mm, with a free-spectral range of 0.60 GHz. D2 • The reference frequencies (marked X) show deviation from their expected positions by up to 50 MHz • After calibration, the points lie close to a straight line. The inset shows the residual nonlinearity to be less than 5 MHz Transmission difference for the 16.5oC spectrum Future work We will use the predicted absorption and dispersion to find the optimum experimental conditions to produce slow light pulses. Using a hot atomic vapour it is possible to delay nanosecond pulses by many times their width, whilst still having relatively high transmission and low pulse dispersion D1 150oC Conclusion We have developed a model of the Doppler-broadened electric susceptibility for the Rb D lines which uses tabulated coefficients and the complementary error functions for fast and accurate evaluation of atomic spectra. We have shown the model accurately predicts laser transmission provided the light intensity is in the weak-probe limit, giving an rms error of 0.2% for the D2 line at 16.5oC. From our verification of the absorptive properties of the medium, we can be confident that the model is also able to accurately predict dispersion caused by the medium. Predicted group refractive index and absorption coefficient. For large delay/transmission, we detune from resonance by several GHz References [1] Camacho R M, Pack M V, Howell J C, Schweinsberg A and Boyd R W 2007 Phys. Rev. Lett. 98 153601. [2] Vanner M R, McLean R J, Hannaford P and Akulshin A M 2008 J. Phys. B 41 051004. [3] Loudon R The Quantum Theory of Light (Oxford University Press, Oxford, Third edition, 2000). [4] Arimondo E, Inguscio M, and Violino P 1977 Rev. Mod. Phys. 49 31. [5] Gustafsson J, Rojas D, and Axner O 1997 Spectrochimica Acta Part B52 1937. [6] Rapol UD, Krishna A, and Natarajan V 2003 Euro. Phys. J. D 23 185 [7] Banerjee A, Das D, and Natarajan V 2004 Europhysics Letters65(2) 172. [8] Corney A Atomic and Laser Spectroscopy (Oxford University Press, Oxford, 1977). [9] Sherlock B E and Hughes I G 2008 (in preparation). [10] Smith D A and Hughes I G 2004 Am. J. Phys.72 631 1 P. Siddons, C.S. Adams, C. Ge and I.G. Hughes J. Phys. B 41 155004 (2008)