Download
1 / 34
350 likes | 599 Vues
Sustainable Growth and Development in Brampton Local Economic Indicators. West End Economic Forum Presented by Brian Stittle. Wednesday, June 29, 2005. Overview of Presentation. Brampton, the GTA, and Canada: Performance Indicators Focus on Brampton: Population and Employment

E N D
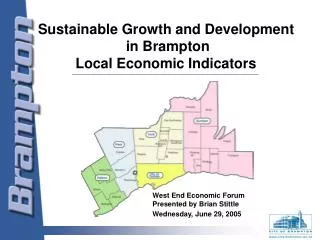
Sustainable Growth and Development in Brampton Local Economic Indicators West End Economic Forum Presented by Brian Stittle Wednesday, June 29, 2005
Overview of Presentation • Brampton, the GTA, and Canada: • Performance Indicators • Focus on Brampton: • Population and Employment • Industry Sectors • Local Economic Indicators • Construction and Development Activity
Definition of the GTA Includes: City of Toronto, Durham, York, Peel and Halton, plus 24 municipalities. Excludes-Mexico Source: GTMA, 2003
Factors Driving Growth in the GTA • High Concentration of Employment, Business Investment, Consumer Spending and Large Sectors Dominated by Manufacturing and Financial Sectors • Cost Competitiveness (labour; construction; leasing and transportation) • Population Factors (Natural Increase; Immigration) • Existing Public Infrastructure and Renewal Initiatives • Quality of Life (Education; Medical Community; HACE; Multiculturalism; Theatre Market) • Location in relation to US Markets • The GTA is an international urban centre
National Performance – Population • Top 5 Municipalities in GTA • Toronto • Mississauga • Brampton • Markham • Vaughan Thousands Source: Statistics Canada, 2001 Census
National Performance - Construction Total Value of Building Permits January – December 2004 Billions ($) Source: Statistics Canada, 2005
National Performance - Residential Total Value of Building Permits January – December 2004 Billions ($) Source: Statistics Canada, 2005
National Performance - Industrial Total Value of Building Permits January – December 2004 Millions ($) Source: Statistics Canada, 2005
National Performance - Commercial Total Value of Building Permits January – December 2004 Millions ($) Source: Statistics Canada, 2005
Population Growth, 2003-2013 GTA Growth – 2013: 894,000 (17%) High Growth Poles: Actual # 2013: 62,000 (32%) 2013: 130,000 (36%) 2013: 59,000 (32%) 2013: 214,000 (8.5%) 2013: 50,000 (8%) Source: Centre for Spatial Economics, 2003
Population Growth, 2003-2013 GTA Growth – 2013: 894,000 (17%) Secondary Growth Poles 2013: 45,000 (31%) 2013: 34,700 (37%) 2013: 32,400 (35%) 2013: 29,200 (37%) 2013: 29,600 (71%) 2013: 43,800 (29%) Source: Centre for Spatial Economics, 2003
Employment Projections, 2003-2011 Source: Centre for Spatial Analysis, 2003
GTA Summary • The GTA experienced 12 consecutive months of employment growth in 2003-2004. • Approximately 100,000 people are added to the GTA population each year and 50,000 new jobs. • The GTA will grow by 1 million people in the next decade. • Toronto and Brampton exceeded $2 billion in Building Permit activity in 2004. • Brampton and Toronto will experience the highest rates of real population, employment and real estate growth in the next decade. • Subject to unpredictable geopolitical conditions, the current economic and financial indicators support stable national, regional and local growth in 2005.
Focus on Brampton • 14th Most Populated City in Canada (10th in 2004) • 3rd Most Populated City in GTA • 2nd Fastest Population Growth of Canada’s Largest Cities • Land area equal to Mississauga • 50% Build-out (Half the City to develop in next 30 years) • Growing infrastructure (410 extension; New GO station; over $1 billion in transportation spending over next 10 years) • 39% of Population represented by new Canadians • A survey of 66 municipalities across Ontario found Brampton to have lower than average tax rates in all property classes, amongst the lowest taxes as a percentage of income. • The City of Brampton is debt-free. • Challenges include: managing growth in a manner whereby city services are delivered and funded in a timely manner.
Brampton Historic Population 1976-2005 Source: Statistics Canada, 1976-2001, City of Brampton Planning Design and Development
Brampton: Population Growth, 1996-2001 % Growth 1996-2001 Source: Statistics Canada, 2001
Brampton Population-Employment Projection Thousands Source: Statistics Canada, 1991-2001; Hemson Consulting Ltd; Planning, Design and Development
Total Population 2006: 432,700 2011: 510,900 2021: 639,600 2031: 687,200 Population Forecast 2006: 122 2011: 7,300 2021: 22,100 2031: 21,500 2006: 12,400 2011: 14,700 2021: 14,100 2031: 13,700 2006: 178 2011: 174 2021: 4,000 2031: 33,500 2006: 40,100 2011: 44,200 2021: 46,100 2031: 44,900 2006: 51,200 2011: 67,500 2021: 72,700 2031: 70,800 2006: 15,500 2011: 26,500 2021: 41,400 2031: 40,400 2006: 2,200 2011: 18,800 2021: 34,400 2031: 33,500 2006: 7,500 2011: 20,300 2021: 46,100 2031: 45,000 Source: Hemson Consulting Ltd; City of Brampton Planning, Design and Development
Total Employment 2006: 176,100 2011: 227,600 2021: 288,900 2031: 322,900 Employment Projections 2006: 318 2011: 3,800 2021: 12,500 2031: 17,400 2006: 100 2011: 100 2021: 3,300 2031: 17,600 2006: 38,500 2011: 45,800 2021: 48,800 2031: 49,000 2006: 4,000 2011: 6,000 2021: 10,500 2031: 12,200 2006: 25,800 2011: 29,900 2021: 35,800 2031: 37,300 2006: 6,500 2011: 20,600 2021: 37,200 2031: 43,000 2006: 7,700 2011: 11,400 2021: 12,400 2031: 12,800 Source: City of Brampton Planning, Design and Development
Brampton: Industry Sectors NAICS Source: Brampton Economic Development Office, 2003 Brampton Employers Survey
Brampton: Manufacturing Clusters * These establishments manufacture a diverse range of products such as medical equipment and supplies, jewellery, sporting goods, toys and office supplies. Source: Brampton Economic Development Office, 2003 Brampton Employers Survey
Brampton: Corporate Headquarters • Nortel Networks (Global Headquarters) • Maple Lodge Farms • Zellers Inc • Bombay Company • Aston Martin Jaguar Land Rover Canada • Magna Technical Training Centre • Velcro Canada • Bacardi Canada • Brita Canada • Italpasta • Atlantis Aerospace Corporation • Loblaw Companies Limited • Clorox of Canada • Blue Giant Limited • Concord Elevator • Nacan Products • Brampton Brick Limited • ACCO Canada • Mandarin Restaurant Limited This list is a sample of the largest employers with a national or global headquarters presence in Brampton. Source: Brampton Economic Development Office, 2005.
Local Economic Indicators Source: City of Brampton Economic Development Office, 2005
Industrial and Office Lease Rates Brampton Industrial Lease Rates Brampton Office Lease Rates GTA West Office Lease Rates Source: Compiled by Brampton Economic Development Office
Total Construction ActivityValue of Building Permits, 1980-2004 2004 continued to set construction records. Current Dollars ($Millions) Source: City of Brampton Planning, Design and Development Department, 1980-2004
Industrial Construction ActivityTotal Construction Value, 1980-2004 Source: City of Brampton Planning, Design and Development Department, 1980-2004
Commercial Construction ValueTotal Construction Value 1980-2004 Source: City of Brampton Planning, Design and Development Department, 1980-2004.
Institutional Construction ValueTotal Construction Value, 1980-2004 Current Dollars ($Millions) Source: City of Brampton Planning, Design and Development Department, 1980-2004
Residential Construction ValueTotal Construction Value, 1980-2004 Brampton will continue to represent a significant portion of the regional new home construction market over the next 15 - 30 years. Current Dollars ($ Millions) Source: City of Brampton Planning, Design and Development Department, 1980-2004
New Housing Units1980-2004 Units (Thousands) The new housing units include detached, semi-detached, townhouse, and apartment. Source: City of Brampton Planning, Design and Development Department, 1980-2004
Construction Update • The total value of construction to March of 2005 was $427.0 million, down slightly from $488.5 million for the same period last year, showing a 12.6% decrease. • Exceeding $2.7 billion in total construction activity in 2004 moved Brampton into position as the second largest construction market in Canada behind Toronto. • The City of Brampton has achieved over $1 billion in construction value for the last five years. With over $2.7 billion achieved in 2004, Brampton’s sustained growth continues to highlight its place as a significant national urban centre. • Residential construction values at $87.4 million are over 75% less than last year. • Brampton’s growth to date in 2005 is being led by a strong industrial construction market with 12 new buildings commenced to date showing a 100% increase over the same period last year.
Construction Update • Brampton’s industrial construction value to date is $173.8 million, up over 160% over last year, the majority of which is attributed to new speculative development. • Industrial speculative construction has to date accounted for close to 2.8 million square feet of new space totalling over $102 million in construction value. • Commercial construction at $21.1 million is down less than 10% and on par with 2004. • Institutional construction value at $140.9 million is up substantially over last year at this time (over 700%). The new hospital permit released in March accounts for $117.7 million itself. • Over 675,000 square feet of new non-residential site plan applications are in process to date in 2005.
Top Non-Residential Construction Projects YTD March 2005 Source: Brampton Planning, Design and Development Department, 2005
Thank You! For further information, please contact: Brian Stittle Economic Development Co-ordinator City of Brampton, 33 Queen Street West Brampton, Ontario, L6Y 1L9 Tel: 905-874-2642 Fax: 905-874-2670 brian.stittle@brampton.ca