Download
1 / 1
10 likes | 210 Vues
Changsheng Li 1 , Steve Frolking 1 , Xiangming Xiao 2 , Carl Trettin 3 and William Salas 4 1 Institute for the Study of Earth, Oceans, and Space, University of New Hampshire, Durham NH. 2 Center for Spatial Analysis, University of Oklahoma, Norman OK.

E N D
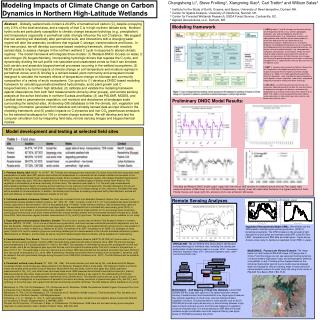
Changsheng Li1, Steve Frolking1, Xiangming Xiao2, Carl Trettin3 and William Salas4 1 Institute for the Study of Earth, Oceans, and Space, University of New Hampshire, Durham NH. 2 Center for Spatial Analysis, University of Oklahoma, Norman OK. 3 Center for Forested Wetlands Research, USDA Forest Service, Cordesville, SC. 4 Applied Geosolutions, LLC, Durham, NH. Modeling Impacts of Climate Change on Carbon Dynamics in Northern High-Latitude Wetlands PALSAR Abstract - Globally, wetland soils contain a 20-25% of terrestrial soil carbon (C), despite occupying only 2-3% of the total land area, and a majority of that C is in high northern latitude soils. Northern hydric soils are particularly susceptible to climatic change because hydrology (e.g., precipitation) and temperature (especially in permafrost soils) strongly influence the soil C balance. We suggest that soil warming will drastically alter permafrost soils, and interactions with a changing water regime will alter the anaerobic conditions that regulate C storage, transformations and fluxes. In this new project, we will develop a process-based modeling framework, driven with remotely sensed data, to assess changes in the northern wetland C cycle in response to altered climatic regimes. The model framework will integrate three models: (1) Wetland-DNDC focuses on water, C and nitrogen (N) biogeochemistry, incorporating hydrologic drivers that regulate the C cycle, and dynamically dividing the soil profile into saturated and unsaturated zones so that it can simulate both aerobic and anaerobic biogeochemical processes occurring in the wetland ecosystems; (2) NEST predicts long-term impacts of climate change on soil temperature and moisture regimes in permafrost zones; and (3) ArcVeg is a nutrient-based, plant community and ecosystem model designed to simulate the transient effects of temperature change on biomass and community composition of a variety of arctic ecosystems Our goal is to (1) develop a DNDC-based modeling framework for simulating permafrost/wetland hydroclimate, arctic plant growth and C biogeochemistry in northern high latitudes; (2) calibrate and validate the modeling framework against observations from both field measurements (done by other groups), and remote sensing analysis at five active field sites in northern Eurasia and Alaska; (3) use PALSAR, MODIS, and Landsat data to parameterize vegetation, soil moisture and disturbance at landscape scale surrounding the selected sites, (4) develop GIS databases to link the climate, soil, vegetation and hydrology information generated from statistical and remotely sensed data as input drivers to the modeling framework; and (5) predict impacts on C dynamics and non-CO2 greenhouse emissions for the selected landscapes for 100-yr climate change scenarios. We will develop and test the computer simulation tool by integrating field data, remote sensing images and biogeochemical models. Co-registration Pre-processed PALSAR Decision Tree & Thresholding Speckle Filtering Radiometric (ie, incidence angle corrections) Adjustments & Normalizations Modeling framework Water: Minimum Ancillary (i.e., GIS, DEM) Wetland/Open Water 1.DNDC predicts C and N transport and transformation by converting primary drivers (e.g., climate, topography, vegetation, soil, and anthropogenic activity) into environmental factors (e.g., temperature, moisture, pH, redox potential and substrate concentration gradients), which then determine the rates biochemical and geochemical reactions. DNDC possesses a relatively complete set of biogeochemical processes for simulating C and N biogeochemistry by tracking vegetation biomass, soil climate, and soil microbial activities (e.g., decomposition, nitrification, denitrification, fermentation). DNDC has been linked to regional datasets generated from statistics or remote sensing analysis for North America, Asia, Europe and Oceania for quantifying impacts of changes in climate or management on C sequestration and trace gas emissions at the regional scales 2.NESTis a process-based model for Northern Ecosystem Soil Temperature, developed to quantify the transient response of ground thermal regimes to climate change (Zhang et al., 2003). The model explicitly considered the effects of vegetation, snow, and different ground conditions, and integrates climate, vegetation, snow, water, and ground temperature based on energy and water exchange. 3.ARC-VEG is a nutrient-based, plant community and ecosystem model designed to simulate the transient effects of temperature change on the biomass and community composition of a variety of arctic ecosystems (Epstein et al., 2000). The model is currently parameterized for upland, mesic ecosystems in high arctic, low arctic, treeline, and boreal forest climate zones. Growth: Dynamic Range Enhancements & Filters Wetland map Assessing Field Attributes & Product Generation Biomass Hydroperiod: Multitemporal Model Enhancements (ie, edge detection, segmentation) Post-processing “cleaning” Preliminary DNDC Model Results: Model development and testing at selected field sites 1.Peatland, Alaska, USA (64.82°N, 147.87°W): Turetsky and colleagues have measured CH4 fluxes since 2005 with ecosystem-scale manipulations of water table (WT) position and surface soil temperatures in a moderate rich fen located outside the boundaries of the Bonanza Creek Experimental Forest, situated approximately 35 km southeast of Fairbanks, Alaska, USA (Alaska Peatland Experiment or APEX, http://apex.msu.edu/). Rich fens represent one of the most common peatland types in western boreal North America. The vegetation is dominated by a diverse community of brown moss. The maximum peat depth is 1 m. The multi-year measurements demonstrated significant impacts of flooding and soil warming on CH4 emissions from the peat soils. The data obtained at the site are unique for calibrating and validating biogeochemical models for predicting of soil climate change on CH4 emissions. Published field data will be available for model evaluation; in addition, the Alaska project includes a modeling component led by Dave McGuire, and we will work with McGuire on model intercomparison studies for this site. 2.Cultivated peatland, Linnansuo, Finland: The study site is located 30 km from Mekrijärvi Research Station (Univ. Joensuu) in an experimental cutaway peatland (called Linnansuo, 62°30’N, 30°30’E). Currently, a total of 5.7 x 10⁶ ha of peatland has been drained for forestry, agriculture or peat extraction (~60% of the peatland area in Finland). Under drained conditions, litter and peat decay rates are enhanced owing to an increase in the aerobic peat layer depth. The experimental site is cultivated with reed canary grass (RCG), a bioenergy crop, and includes a sub-site without any vegetation. Eddy covariance measurements of CO2 and energy fluxes have been running quasi-continuously since 2002; measurements also include ancillary weather and environmental variables (Shurpali et al., 2008). Since 2004, there have been regular chamber measurements of CH4 and N2O gas fluxes. The field datasets will be available for our study. 3.Degrading permafrost peatland, Stordalen, Sweden: This mire site is located near the Abisko Field Research Station in northern Sweden (68o20'N, 19 o03'E). It is in a zone of discontinuous permafrost, and there has been substantial permafrost degradation over the past few decades. Research groups have studied vegetation distribution, hydrology, and biogeochemical cycling across a melt gradient in the peatland for a number of years (e.g., Malmer et al. 2005; Christensen et al. 2007; Johansson et al. 2006). Our colleague of many years, Patrick Crill, and his research group are conducting detailed gas flux measurements at this site with automated chambers systems (Bäckstrand et al. 2008a,b), and this data, as well as long-term meteorological data from Abisko, will be available for model testing. 4.Forested wetland, Tver, Russia: The site is in the Central Forest Biosphere Reserve (56o27'N, 32 o55'E) at Fyodorovskoe in Tver, Russia. Net ecosystem exchange of carbon (NEE) has been being measured with eddy covariance since 1999. The site has average annual temperature 3.9C and precipitation 711 mm for the 1990s. The vegetation is dominated by spruce with undergrowth of birch and other shrubs, and a 60 cm Sphagnum peat layer with the tree roots throughout the whole profile. The soil C content in the peat layer is about 197 t C ha-1. The water table is near to or above the soil surface. NEE data indicate that the wetland ecosystem has been shifting to be a net source of atmospheric CO2 since 1999. A preliminary modeling test showed that the change in the ecosystem C dynamics could be related to the soil hydroclimate changes during the period from 1999-2004 (Kurbatova et al., 2007). The field datasets will be available for our study. 5.Permafrost wetland, Lena, Russia (72°22N, 126°28E): A Russian-German joint team led by Drs. Julia Boike and Dirk Wagner conducted climate, soil and trace gas measurements in the Samoylov Research Station (Lena delta). The Samoylov Station is an Arctic tundra site located at the southern coast of Samoylov Island within the Lena Delta, close to the Laptev Sea. Eddy covariance measurements of CH4, CO2, and other fluxes have been made since 1998 (www.awi.de/en/infrastructure/stations/samoylov_station/). Methane emissions have been measured with closed chambers. The Lena Delta is a key region for the understanding of the basic processes of the dynamics and development of permafrost in the Siberian Arctic. The research station was set up as a logistic base for long-term field investigations on the processes of permafrost formation and decay, emissions of greenhouse gases (CH4 and CO2), and hydrology of the active layer, with support from German and Russian scientific ministries. The field datasets will be available for our study. Bäckstrand, K., P.M. Crill, M. Mastepanov, T.R. Christensen and D. Bastviken. 2008a. Nonmethane Volatile Organic Compound Flux from a Subarctic mire in Northern Sweden. Tellus, 60B, 226-237. Bäckstrand, K., P.M. Crill, M. Mastepanov, T.R. Christensen and D. Bastviken (2008b-in press). Total Hydrocarbon Flux Dynamics at a Subarctic mire in Northern Sweden. JGR-Biogeosciences. Kurbatova, J., Li, C., Varlagin, A., Xiao, X., and Vygodskaya, N.: Modeling carbon dynamics in two adjacent spruce forests with different soil conditions in Russia, Biogeosciences, 5, 969-980, 2008. Shurpali NJ, NP Hyvönen, JT Huttunen, C Biasi, H, N Pekkarinen, PJ Martikainen. 2008. Bare soil and reed canary grass ecosystem respiration in peat extraction sites in Eastern Finland, Tellus, 60B, 200–209. Field data and Wetland-DNDC model output: (upper left) inter-annual NEE variation in a wetland spruce forest at Tver, (upper right) seasonal variation of NEE fluxes for a SSA fen at Saskachewan, Canada, (lower left) water table fluctuation at a cypress wetland at Gator, Florida, Russia, and (lower right) CH4 emissions from a fen at Marcell, Minnesota. Remote Sensing Analyses larch forest, Hokkaido, Japan Vegetation Photosynthesis Model (VPM): We will also use the VPM model to estimate gross primary production (GPP) of terrestrial ecosystems. The VPM is based on the concept of light absorption by chlorophyll and estimates daily GPP, using EVI and LSWI , temperature and PAR data as model inputs. Figure above shows a case study for deciduous needeleaf forest (TMK) in Japan. OPTICAL/NIR- We use MODIS time series data to identify land surface phenology for individual sites, including the starting and ending dates of plant growing season in a year. NDVI – Normalized Difference Vegetation Index, EVI – Enhanced Vegetation Index; LSWI – Land Surface Water Index MICROWAVE - Poyang Lake Wetland Example:The image below is a multi-temporal PALSAR image of Poyang Lake in China. From this image one can see seasonal flooding dynamics of natural wetland (light green hues) and anthropogenic wetlands (rice paddies in red). Flooding will be mapped based on the enhanced backscatter periods due to double bounce between water and vegetation. We are creating maps of hydro-period for natural wetland systems for each study site using a time series of PALSAR Fine Beam (FBS, FBD, PLR). MICROWAVE – SAR Mapping of Study Site Wetlands:L-band SAR systems are the single best option for fine spatial resolution remote sensing of wetland extent and characteristics over large regions because they operate regardless of cloud cover, and can distinguish basic vegetation structure. A dual-polarization L-band system such as ALOS PALSAR will provide improved accuracy in discriminating between rough water surfaces and bare ground, and improved mapping of vegetation structural characteristics. Our pre-processing of SAR data will include incidence angle normalization and multi-temporal filtering (see figure above for PALSAR processing flow chart).