Comprehensive Evaluation of NWRFC CHPS Forcing Study for Enhanced Gridded Data Accuracy
The NWRFC CHPS Forcing Study aims to compare current operational processes with calibration Mean Areal Precipitation (MAP), create a historical grid for evaluation, and develop methods for producing unbiased grid MAP. With gridded data becoming more available, the study prepares for advanced modeling systems while aligning hydrology with agency direction. A comprehensive analysis of hourly precipitation data, bias assessments, and future calibration methods are included. The results indicate strong relationships in most sites, with a focus on improving accuracy and methodology for future assessments.

Comprehensive Evaluation of NWRFC CHPS Forcing Study for Enhanced Gridded Data Accuracy
E N D
Presentation Transcript
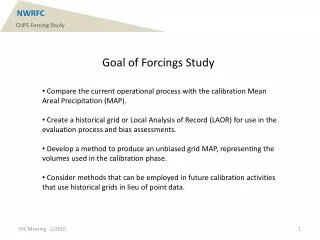
NWRFC CHPS Forcing Study Goal of Forcings Study • Compare the current operational process with the calibration Mean Areal Precipitation (MAP). • Create a historical grid or Local Analysis of Record (LAOR) for use in the evaluation process and bias assessments. • Develop a method to produce an unbiased grid MAP, representing the volumes used in the calibration phase. • Consider methods that can be employed in future calibration activities that use historical grids in lieu of point data.
NWRFC CHPS Forcing Study Rationale for Gridded Data Forcings • CAT-I decision to retire the OFS Preprocessors. • Data sets (becoming) readily available in gridded form. • Preparation to use new/advanced modeling systems, ie., distributed modeling. • Aligns hydrology with agency direction in data assimilation, verification, and research programs.
NWRFC CHPS Forcing Study Steps of Study Procedure • Generate quality and consistent hourly point precipitation from the point data network used in the calibration process • + OHD provided special MAP program • + Post point data to a new database • Create 6-hour and 24-hour aggregates from hourly point data (output from MAP program). • Use auto_mpe_dailyQC to generate historical 6 and 24 hour grids for the calibration period of 1949 to 2003. • Employ an instance of a CHPS stand alone system to compare calibration (OFS point) MAPS and new generated historical MAPX (MPE). • Use CHPS and Excel to generate statistics for analysis.
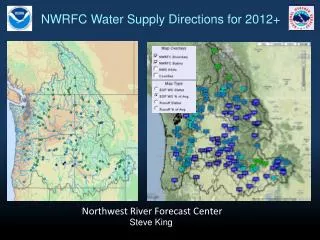
NWRFC CHPS Forcing Study Sample of Grids Produced by MPE dailyQC
NWRFC CHPS Forcing Study Schematic of Process 55 Years 6 and 24 Grids Excel Evaluation OHD MAP Program Database Tables Database Tables CHPS 6 and 24 hr Precip values 1 hr Precip calibration sites 6 and 24 hr Precip values MPE Auto_dailyQC Grids MAP and MAPX Grids
NWRFC CHPS Forcing Study Issues • MAP fails to accurately disaggregate the 6-hour data to 1-hourly values. Values are lumped in a single 1-hr data point. • Address multiple time zones. For an RFC that crosses multiple time zones, data must be loaded taking actual time into account. • MAP program renders 6-hour MAP in local time. Supplied MPE 6 hour data in local time. Adjustments must be made in CHPS so MAP and MAPX represent the same period. • CHPS limited to 20 years of data for historical calculation. The full 55 years of grids split into multiple groups. • CHPS generates historical time series with output used by Excel for analysis and scatter plot generation.
NWRFC CHPS Forcing Study Sites Include in Evaluation
NWRFC CHPS Forcing Study
NWRFC CHPS Forcing Study Typical Comparison
NWRFC CHPS Forcing Study Typical Comparison
NWRFC CHPS Forcing Study Bitterroot Basin Has Issues
NWRFC CHPS Forcing Study Results • The majority of sites analyzed exhibited R2 > .80 over the 55 years. • Considerable scatter for all sites and also need to look at categories. • Bitterroot basin has the weakest relationship. • Bias between sites is not consistent. • Bias for a site is not consistent from month to month. • Analysis using 1971-2000 only shows a minor improvement in the relationships. • Process is very simple and easy to update.
NWRFC CHPS Forcing Study Future • Develop QC points for Western Oregon. Needed for final LAOR grid. • Develop method to disaggregate values from MAP that were not time distributed. • Analysis runs (today) on 6-hour data. • Analysis using simulations and runoff to determine impacts of this solution. • Automate the bias correction process.