Download
1 / 1
10 likes | 78 Vues
White Sea Student Workshop on Optics of Coastal Waters 30 August – 7 September 2014, Nikolai Pertsov White Sea Biological Station, Northern Russia. Complex Study of Kislo-Sladkoye Lake Stratification. 1 Kalmatskaya O.A., 1 Kharcheva A.V., 1 Laptinskiy K.A., 1 Medvetskaya I.Y.,

E N D
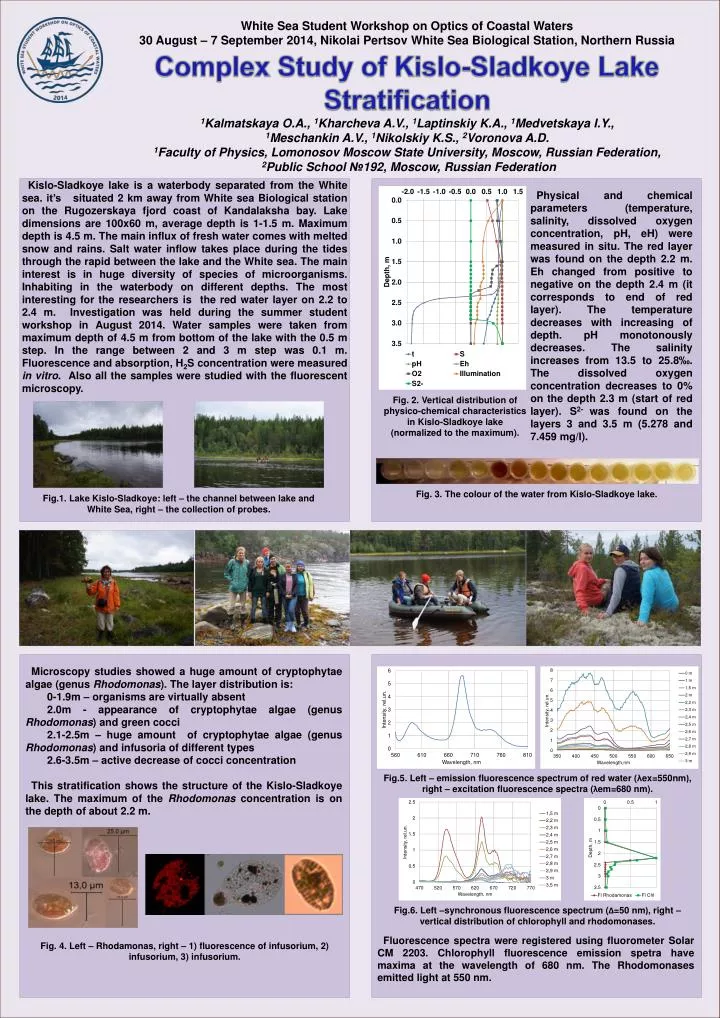
White Sea Student Workshop on Optics of Coastal Waters 30 August – 7 September 2014, Nikolai Pertsov White Sea Biological Station, Northern Russia Complex Study of Kislo-Sladkoye Lake Stratification 1Kalmatskaya O.A., 1Kharcheva A.V., 1Laptinskiy K.A., 1Medvetskaya I.Y., 1Meschankin A.V., 1Nikolskiy K.S., 2Voronova A.D. 1Faculty of Physics, Lomonosov Moscow State University, Moscow, Russian Federation, 2Public School №192, Moscow, Russian Federation Kislo-Sladkoye lake is a waterbody separated from the White sea. it’s situated 2 km away from White sea Biological station on the Rugozerskaya fjord coast of Kandalaksha bay. Lake dimensions are 100x60 m, average depth is 1-1.5 m. Maximum depth is 4.5 m. The main influx of fresh water comes with melted snow and rains. Salt water inflow takes place during the tides through the rapid between the lake and the White sea. The main interest is in huge diversity of species of microorganisms. Inhabiting in the waterbody on different depths. The most interesting for the researchers is the red water layer on 2.2 to 2.4 m. Investigation was held during the summer student workshop in August 2014. Water samples were taken from maximum depth of 4.5 m from bottom of the lake with the 0.5 m step. In the range between 2 and 3 m step was 0.1 m. Fluorescence and absorption, H2S concentration were measured in vitro. Also all the samples were studied with the fluorescent microscopy. Physical and chemical parameters (temperature, salinity, dissolved oxygen concentration, pH, eH) were measured in situ. The red layer was found on the depth 2.2 m. Eh changed from positive to negative on the depth 2.4 m (it corresponds to end of red layer). The temperature decreases with increasing of depth. pH monotonously decreases. The salinity increases from 13.5 to 25.8‰. The dissolved oxygen concentration decreases to 0% on the depth 2.3 m (start of red layer). S2- was found on the layers 3 and 3.5 m (5.278 and 7.459 mg/l). Fig. 2. Vertical distribution of physico-chemical characteristics in Kislo-Sladkoye lake (normalized to the maximum). Fig. 3. The colour of the water from Kislo-Sladkoye lake. Fig.1. Lake Kislo-Sladkoye: left – the channel between lake and White Sea, right – the collection of probes. Microscopy studies showed a huge amount of cryptophytae algae (genus Rhodomonas). The layer distribution is: 0-1.9m – organisms are virtually absent 2.0m - appearance of cryptophytae algae (genus Rhodomonas) and green cocci 2.1-2.5m – huge amount of cryptophytae algae (genus Rhodomonas) and infusoria of different types 2.6-3.5m – active decrease of cocci concentration This stratification shows the structure of the Kislo-Sladkoye lake. The maximum of the Rhodomonas concentration is on the depth of about 2.2 m. Fig.5. Left – emission fluorescence spectrum of red water (λex=550nm), right – excitation fluorescence spectra (λem=680 nm). Fig.6. Left –synchronous fluorescence spectrum (Δ=50 nm), right – vertical distribution of chlorophyll and rhodomonases. Fluorescence spectra were registered using fluorometer Solar CM 2203. Chlorophyll fluorescence emission spetra have maxima at the wavelength of 680 nm. The Rhodomonases emitted light at 550 nm. Fig. 4. Left – Rhodamonas, right – 1) fluorescence of infusorium, 2) infusorium, 3) infusorium.