Monitor the Quality of your Master Data
430 likes | 638 Vues
Monitor the Quality of your Master Data. THOMAS RAVN TRA@PLATON.NET. March 16th th 2010, San Francisco. Platon. A leading Information Management consulting firm Independent of software vendors Headquarter in Copenhagen, Denmark 220+ employees in 9 offices 300+ customers and 800+ projects

Monitor the Quality of your Master Data
E N D
Presentation Transcript
Monitor the Quality of your Master Data THOMAS RAVN TRA@PLATON.NET March 16thth 2010, San Francisco
Platon • A leading Information Management consulting firm • Independent of software vendors • Headquarter in Copenhagen, Denmark • 220+ employees in 9 offices • 300+ customers and 800+ projects • Founded in 1999 • Employee owned company “Platon received good feedback in our satisfaction survey. Clients cited the following strengths: experience and skill of consultants, business focus and the ability to remain focused on the needs of the client, and a strong methodological approach” Gartner July 2008
Key Concepts and Definitions “Master Data Management (MDM) is the structured management of Master Data in terms of definitions, governance, architecture, technology and processes” “Information Management is the discipline of managing and leveraging information in a company as a strategic asset” Information Management Data Governance MDM DQM “Data Governance is the cross-functional discipline of managing, improving, monitoring, maintaining, and protecting data” “Data Quality Management is the discipline of ensuring high quality data in enterprise systems”
Components of an effective MDM approach Formalize business ownership and stewardship around data. Ensure that Master Data is taken into account each and every time a business process or an IT system is changed. To be able to share data you need to share definitions and business rules. Definitions require management, rigor and documentation. Control in which systems Master Data is entered and how it is synchronized across systems. Manage Master Data Repository. Capturing Master data efficiently needs to be built into the business processes. Equally consistent usage of Master Data needs to be ensured across business processes and business functions. Measure and monitor the quality of data
Typical Data Problems - 1 How much did we spend with IBM last year?
Typical Data Problems - 2 Is this the same customer? Are these the same products?
Typical Problems - 3 • A common problem is overloading of fields, which is the misuse of a field compared to the intended use. Often because the field the user wanted to use wasn’t available in the application • Sometimes a field might even have been used for different purposes by different parts of the organization
Where Does the Bad Data Come From? State is a required field – regardless of country
Top 5 Sources of Bad Data • Lack of ownership and clearly defined responsinility • Lack of common definitions for data • Lack of control of field usage • Lack of process control • Lack of synchronization between systems
What is Good Data Quality? • Larry English: • Quality exists solely in the eye of a customer of a product or service based on the value they perceive • Information quality is consistently meeting ‘end customers’ expectations through information and information services, enabling them to perform their jobs effectively • To define information quality, one must identify the "customer" of the data - the knowledge worker who requires data to perform his or her job Platon definition: Data Quality is the degree to which data meets the defined standards
“The Law of Information Creation” “Information producers will create information only to the quality level for which they are trained, measured and held accountable.” Larry English
Data Standards & Data Quality • Good Meta Data is prequisite to achieve great data quality (inferred from the trained part of the ”Law of Information Creation”) You can only achieve high quality data if you have standards to measure against! It’s all about the Meta Data…
Defining Good Data standards For every entity define: For every field define: • Definition and keys • Business description • Hierarchies • Data entry format and conventions • Classification(s) • Definition owner • Life cycle • Stakeholders • Business Owner(s) Consider what a user needs to know to produce high quality data
Data Standards – An Example • Challenges • Relating the data definitions to the process documentation • Keeping the definitions up to date • The same piece of information may be entered in multiple different systems
Defining Good Data standards • There are two basic approaches to defining your data standards • Define a system independent Enterprise Information Model and then map attributes to system fields, or • Define data definitions for a system (screen/table) specific view of data • If you have one primary system where a data entity is used, option 2 is preferable • If you have many different systems where the same data entity is used, option 1 is preferable
Generating Garbage • Garbage In = Garbage Out • QualityStandard1 In + QualityStandard2 In • = Garbage Out
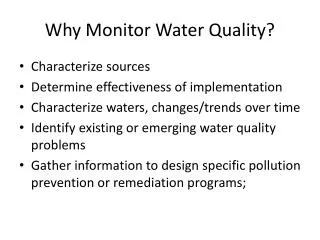
Data Quality Monitoring • Like most other things, data quality can only be managed properly if it is measured and monitored • A data quality monitoring concept is necessary to ensure that you identify • Trends in data quality • Data quality issues before they impact critical business processes • Areas where process improvements are needed
Data Quality Monitoring For this to work, clearly-defined standards, targets for data quality and follow-up mechanisms are required There is little point in monitoring the quality of your data if no one in the business feels responsible and if clear business rules data have not yet been defined Thus a data quality monitoring concept should go hand in hand with a data governance model
The Dimensions of Data Quality Are all data values within the valid domain for the field? Do we have all required data? Validity Completeness Does data reflect the real world objects or a trusted source? Data Quality Timeliness Accuracy Are data available at the time needed? Consistency • Integrity Are business rules on field and table relationships met? Are shared data elements synchronized correct across the system landscape?
The Dimensions of Data Quality Business Impact Accuracy Timeliness Consistency Integrity Validity Completeness Difficulty of Measurement
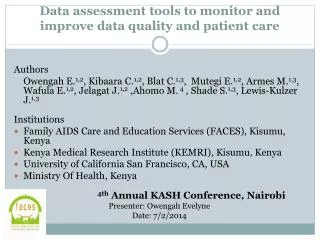
The steps in building a monitoring concept • Building a data quality monitoring concept involves the following five basic steps: • Identify stakeholders • Conduct interviews with stakeholders and selected business users • Identify data quality candidate KPI’s • Select KPI’s for data quality monitoring • For each KPI, define details
Finding Good Data Quality KPI’s • To find good data quality KPIs collect business input through interviews with stakeholders (use Interviewing Technique) and a data assessment. The technique Data Profiling contains more details on how to analyze data • Collect business input • Business process requirements • Data quality pain points • Business Intelligence • Business KPIs KPI Candidates DEFINED KPIs XXX XXX XXX XXX XXX XXX XXX XXX XXX Perform a thorough data assessment (profiling) exercise searching for common data quality problems and look for abnormalities
Tying Data Quality KPIs to Business Processes • It is essential that KPIs are not just made up, so your organization has something to measure • Don’t measure data quality because it’s great to have high quality data. Measure it because your business processes depend on it • Derive data quality KPIs from business process requirements • Start with a high level business process like procurement (also known as a macro process) and then break it down.
Tying Data Quality KPIs to Business Processes Data Entity Scope Define the data entities used within the process Procurement Material Master Data Macro process Vendor Master Data Process Vendor Selection Spend analysis Data quality requirements DEFINED KPIs No duplicate vendors Correct industry code for vendors Correct placement in hierarchy (parent vendor) Correct email address for vendors Is the required data quality aspect meaningful to monitor? Business Meta Data Ex: A vendor record is uniquely defined as an address of a vendor where we place orders, receive shipments from or….. It may be better to improve data validation or perhaps problems are not experienced Business Meta Data is required to define the actual KPIs.
Tying Data Quality KPIs to Business Processes • Using a simple model like the one illustrated on the previous slide allows you to tie data quality KPIs to business processes and to business stakeholders • This relationship is critical for the success of the data quality monitoring initiative. Clearly illustrating how poor data quality impacts specific business processes is instrumental in getting the executive support and the business buy in • When conducting data quality KPI interviews you may encounter KPI suggestions like “measure if there is a valid relationship between gross weight and product type”. Ask why this is important and which process this is important for • A particular data quality KPI may be important for multiple different processes. Document the relationship to all relevant processes
Defining Data Quality KPI’s • Data quality KPIs should express the important characteristics of quality of a particular data element • Typically units of measures are percentages, ratios, or number of occurrences • For consistency reasons, try to harmonize the measures. If for instance one measure is “number of customers without a postal code” while another is “percentage of customers with a valid VAT-no” a list of measures will look strange, since one measure should be as high as possible, and the other as low as possible • A good simple approach is to define all data quality KPI’s as percentages, with a 100% meaning all records meet the criteria behind this KPI • Be careful not to define too many measures, as this will just make the organizational implementation more difficult • Pay attention to controlling fields (like material type) that may determine rules like whether a specific attribute is required
Defining Hierarchies Avg. Value KPI: Customer Fax number correctly formatted 25% • Data Insight • Fax numbers are not required for US customers since all communication is done via email. • Fax is the primary communication channel with Canadian customers. • Only some customers in Mexico have a fax machine. Value Recs 85,000 5% US Customers 19,000 77% CA Customers 38,000 43% MX Customers Use hierarchical measures where possible, so that measures can be rolled up in regions and countries for instance In the below example a KPI related to customer data is broken down in individual countries to allow detailed follow up A concern here is that fields may be used differently in different countries. Given the below data insight, it might make sense to define a separate KPI’s for CA and perhaps ignore MX and US
Defining KPI Thresholds Target Value: 95 % Lowest acceptable value: 80 % • Along with each KPI two thresholds should be defined: • Lowest acceptable value • Without specifying the lowest acceptable value (or worst value), it’s difficult to know when to react • If the measure falls below this threshold action is required • Target value • Without target values, you don’t know when the quality is ok. Remember fit-for-purpose • Specifying a low and target threshold allows for traffic light reporting that provides an easy overview • Defining appropriate thresholds can be difficult as even a single product record with wrong dimensions may cause serious process impact. But without any indication of when to be alerted any form of automated monitoring is difficult
Indirect Measures • Consider critical fields (e.g. weight of a product or customer type) where the correct value is of utmost importance, but it’s close to impossible to define the rules to check if a new value entered is correct…. • One approach is to measure indirectly by for instance reporting what users have changed these values for which products over the last 24 hours, week or whatever is appropriate in your organization
Cross field KPIs and Process KPIs • Common KPIs that are not related to a single field • Number of new customer records created this week • Average time from request to completion of a new material record • Number of materials with a non-unique description (or pct. of materials with a unique description) • Number of vendors, where a different payment is defined in different purchasing organizations • Number of open sales orders referring to an inactive customer
Think Prevention! Every possible business rule related to completeness, integrity, consistency and validity should be enforced by the system at the time of data entry. If it isn’t, consider implementing a data input validation rule rather than allowing bad data to be entered and then measure it! However, there are cases, where the business logic of a field is too ambiguous to be enforced by a simple input validation rule. Process (workflow) adjustments may also be the answer.
Remember! • Quality is in the Eye of the beholder! • Data quality is defined by our Information Customers • Data is not always clean or dirty in itself – it may depend on the viewpoint and a defined standard • Focus on what’s important to those that use the data
Monitoring Process Publish KPI Analyze KPIs Low value in KPI? Y Evaluate root cause Plan corrective actions Implement Improvements N A simple example
Monitor the Quality of your Master Data Thomas Ravn Practice Director, MDM E: tra@platon.net M: +1 646-400-2862 PLATON US INC. 5 PENN PLAZA, 23rd Floor NEW YORK NY 10001 www.platon.net 37