Download
1 / 32
320 likes | 339 Vues
Learn how a conflict-based approach using Bayesian Networks can detect abnormal situations in production plants. Discover a novel method that combines a causal structure and data-driven learning to monitor systems and issue alerts. Explore examples from coal power plants and oil production facilities to understand the effectiveness of the proposed conflict resolution technique.

E N D
On-line Alert Systems for Production Plants A Conflict Based Approach
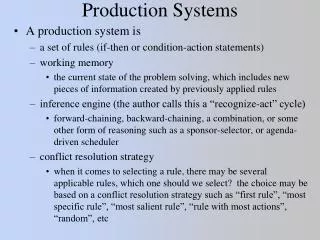
Alert Systems • Based on sensor readings, raises a flag in case of an abnormal situation • Researchers construct a system using Bayesian Networks to detect abnormal situations and generate alerts
Typical Production Plant S1 S2 Sn C1 C2 Cn
Common Issues • Engineers’ knowledge of plant is not sufficient for providing a causal structure • Process is too complex to specify the possible faults and how to detect them based on sensor readings • Difficult to determine the delay from event to effect • Faults are so rare that statistics cannot be used to learn neither the structure nor the parameters of a model of the faults • Difference between a true value and its sensor reading; true values should appear as hidden variables
Causal Approach • Collect as much causal structure as possible and combine with a data driven learning method • Limitations • Learning algorithms cannot cope with domains with a massive set of hidden variables • It is not obvious how such a model could be used for classifying abnormal behavior
Proposed Method • Learn a Bayesian Network representing normal operation only • Does not require information about possible faults or modeling of abnormal behavior • Faults are detected by measuring conflict between model and sensor readings
Proposed Method • Consists of two steps: • Learning a model of the sensors for normal operation • Using the learned model to monitor the system, initiate alerts and perform on-line diagnostics
Learning a Model • Can be done in many different ways • In this paper the researchers analyzed the database of sensor readings during normal operation where the variables are the sensors and hidden variables are the components of the system
Initiation of Alerts • Sensor readings are received in a constant flow • Readings are chopped up into time steps of 1 second • Therefore every second we have evidence for every variable in the model
Conflict Measure of Evidence • Let evidence be e = {e1,…,en} and the conflict measure of the evidence is:
Detecting Conflict • In general during normal operating we expect: conf(e) ≤ 0 • An indication of an abnormal situation is detected when: conf(e) > 0
Problem with Conflict Measure • A negative conflict value does not necessarily imply that we have a normal situation • If sensors are strongly correlated during normal operation, the conflict level will be very negative • A few conflicting sensors therefore will not cause the entire conflict to be positive • To detect watch for jumps in the conflict level
Tracing Source of Alert • Greedy Conflict Resolution • Recursively remove the sensor reading that reduces the conflict the most • Stop when conflict is below a predefined threshold • Can be performed very fast using: fast retraction, lazy propagation or arithmetic circuits
Sample Data set • Used sample data from normal operation to learn model for coal mill • Two data sets covered actual errors/abnormal situations: • The fall-pipe leading coal into the power plant becomes clogged • A temperature sensor becomes faulty
Clogged Fall-Pipe Conflict Resolution • Indicated that the sensor measuring the water-percentage in the coal can explain all the conflicts • There is no sensor for Fall-Pipe clog detection so this is the closest sensor that could explain the conflict • Result was consistent with the analysis of the plant Engineers
Faulty Sensor Conflict Resolution • Indicated that six significant sensors could explain the conflict • Engineers indicated that four of the six were actually significant, the other two were anomalies due to the model
Oil Production Facility • Simulated cases for normal system operation • Two other data sets covered errors/abnormal situations: • Simulated faults in the pumping system • Simulated faults in the cooling system
Change Point Detection • Note that in the previous plots that the conflict measures where all negative indicating no faults • However, remember the problem if the sensors are strongly correlated (slide 15) • In order to perform conflict resolution the conflict threshold should be based on values observed during normal operation • In order to detect changes in system operation need to track jumps in the conflict measure
Change Point Detection • Assume conflict values for normal operation are independent samples from normal distribution with fixed mean and variance • Model the l’th conflict value as random variable with normal distribution f where mean l and variance l2 are estimated using the last m observations:
Change Point Detection • To detect change point calculate the logarithmic loss for the last n observations and raise alert in case the value is above a predefined threshold:
Change Point Detection • This approach is sensitive to fluctuations and results in false positives; also has difficulty detecting drifts in conflict measure • To alleviate this compare model with another model f’ where mean and variance estimated by shifting s observations back:
Change Point Detection • Compare models (score difference):
Change Point Detection • For normal operation score should be within the interval [- : ] • will determine the ratio of false positives and false negatives • n determines the response time of the system • m determines the relevant history • s the number of observations to shift back