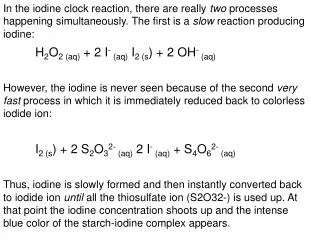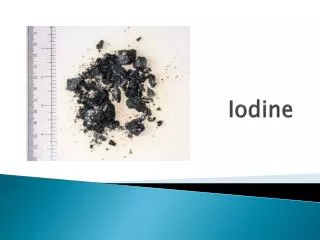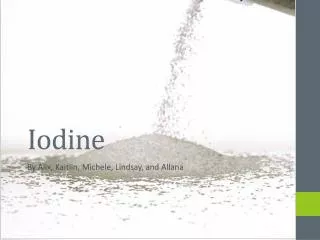
Iodine Clock Reaction
Iodine Clock Reaction. or How Long Does a Reaction Take?. Three Mysteries:. 1. How can the reaction between two molecules (that appear too small and move too fast) be explored? 2. How does concentration affect the rate of a reaction? 3. How can the reaction:

Iodine Clock Reaction
E N D
Presentation Transcript
Iodine Clock Reaction or How Long Does a Reaction Take?
Three Mysteries: 1. How can the reaction between two molecules (that appear too small and move too fast) be explored? 2. How does concentration affect the rate of a reaction? 3. How can the reaction: • KIO3 + 3H2SO3→ KI + 3H2SO4 • be monitored when each species is colorless?
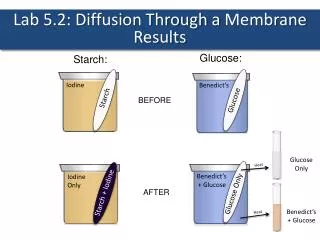
Some Answers: • Since the product, I- (from KI) is colorless and hard to detect, a series of simpler reactions make it easy to detect by forming a blue complex. • I2 + starch → I2-starch (blue) • This can only occur when there is an EXCESS of I2 • SEE HANDOUT!
To explore this reaction, the concentration of the H2SO3, the temperature and presence of a possible catalyst are carefully and selectively controlled. Continuing with answers
Experiment: Effect of [iodate] • To explore the reaction, the concentration of the IO3-, is varied.
Put on your lab apron and safety goggles. Obtain approx. 21 mL of solution B in your large graduated cylinder. Obtain 15 mL of solution A (KIO3) in your smallest beaker. Apron & goggles Large graduated cylinder Solution B Smallest beaker Solution A Procedure
Use large tt for measuring and mixing. • Prepare the first trial by measuring 5 mL of Solution A in your small graduated cylinder and 5 mL of Solution B in your large graduated cylinder. 6. Prepare the second trial by measuring 4 mL of Solution A and 1 mL in your small graduated cylinder and 5 mL of Solution B in your large graduated cylinder Use tap water for diluting. 7. Before mixing the two solutions, make sure the stop watch is ready. • large test tubes • Solution A • Solution B • Small & large graduated cylinders • Tap water • Stop watch
8. Have one person start the stopwatch when the second person pours the solution into the other. Then pour the mixture back and forth three times. Be careful. Spillage can have a BIG effect on your results! 9. When the blue color appears, stop the timing.
The four trials • Trial Tube 1 Tube 2 • 1 5.0 mL A 5.0 mL of B • no of water • 2 4.0 mL A 5.0 mL of B • 1.0 mL of water • 3 3.0 mL of A 5.0 mL of B • 2.0 mL of water • 4 2.0 mL of A 5.0 mL of B • 3.0 mL of water
Helpful hints • Measure volumes accurately! • Read from the bottom of the meniscus. • Pour carefully! • Designate one partner to do the mixing and one to do the timing. • Start timing as soon as the first pour begins. • Record time to the nearest second.
Use all your clean test tubes before rinsing. • Dry with paper towel after rinsing. • Paper towels
Pre Lab Calculations: • Initial [ A ] = 0.010 M • [A] = Initial [A] x volume A (volume A + volume H2O)
Post lab – I2 Clock Reaction • Use good graphing technique to present your results. Graph time vs. [iodate]. • Do NOT expect a straight line. Use a best fit line or curve. • Conclusion: • What do your results show about the relationship between reactant concentration and reaction rate? Remember you measured reaction time not rate. You must make the appropriate logical step in your explanation. • What are a couple of weaknesses or limitations in the experiment that may have affected the reliability of your results? • results. Graph [iodate] vs time. • Plot independent variable on Y axis and dependent variable on the X axis. Hint: Time depends on concentration! Do not expect a straight line. Use a best fit line which represents an average of the data.