GSS: Advanced Spreadsheet for Geochemical Data Manipulation and Plotting
140 likes | 250 Vues
GSS is a powerful spreadsheet tool designed for the manipulation and plotting of geochemical data. Users can enter chemical data for multiple samples and perform critical geochemical calculations. The application allows for the generation of various diagrams, including time series plots, Piper diagrams, and stability diagrams for chemical reactions. Features include unit conversions, reaction balancing, and equilibrium constant calculations, along with options to visualize results in multiple plot formats. Ideal for researchers and professionals in geochemistry.

GSS: Advanced Spreadsheet for Geochemical Data Manipulation and Plotting
E N D
Presentation Transcript
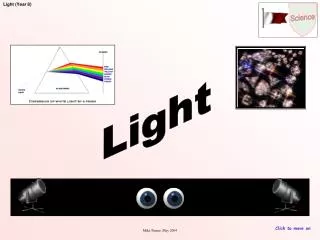
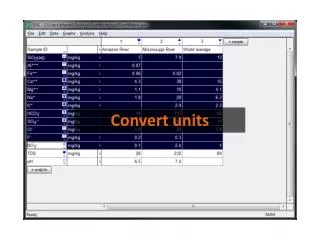
GSS is a spreadsheet for manipulating and plotting geochemical data. Right-click on unit field to convert units
Enter chemical data for one or more samples in GSS, then perform geochemical calculations. Select a mineral then click Apply Calculated saturation indices added to spreadsheet + analyte→ Calculate…
You can display your data in Time Series and XY plots Graphs → Time Series Plot
You can choose from a variety of water chemistry plots Graphs → Piper Diagram
Rxn balances chemical reactions and calculates equilibrium constants, equilibrium equations, and more. Choose species to appear on left side of reaction. Rxn will automatically add its default set of species. Move to the Results pane. Rxn writes a reaction with Pyrite on the left side, balanced by the default basis species
Recast the reaction by performing basis swaps. Click to swap out an entry, then choose a species to replace it Fe(OH)3(ppd) has been swapped in for Fe++ O2(g) swapped in for O2(aq) The reaction is automatically rebalanced in terms of a ferric iron mineral and O2(g).
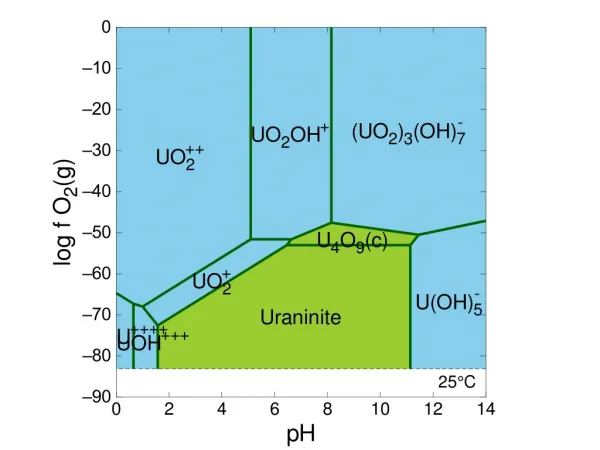
Act2 generates stability diagrams on activity, Eh, pe, pH, and fugacity axes Select main species to diagram Choose axes Add any background ions Run → Go draws the diagram
Move to the Plot pane. Minerals plot in gold, aqueous species in blue You can copy the diagram to the clipboard and paste into your documents
Tact makes temperature-activity and temperature-fugacity diagrams Equilibrium point of the methane souring reaction, calculated as a function of temperature. CH4(g) + Anhydrite ↔ Calcite + H2O + H2S(g)
SpecE8 figures concentrations of aqueous and sorbed species, mineral saturation, and gas fugacity Enter your fluid composition on the Basis pane Swap in gases of known fugacity, or minerals at equilibrium Set dissolved concentrations in units of your choice Set temperature Click to add new entries
View results as a text file… Species listed in order of molal concentration Activity coefficients Species activities
… or plot results in Gtplot Set “Variable type”, then choose from the list of variables Set X and Y axes
TEdit is a graphical application for quickly and accurately editing and combining thermodynamic datasets. Entry for the mineral Hematite (Fe2O3) Reaction, log K at the principal temperatures