Download
1 / 48
480 likes | 600 Vues
The Global Appraisal of Individual Needs (GAIN) Evaluator’s Handbook: Practical Guidelines for Using GAIN Data To Support Local and Cross-Site Program Evaluation and Development. Michael Dennis, Melissa Ives, & Rodney Funk Chestnut Health Systems, Bloomington, IL

E N D
The Global Appraisal of Individual Needs (GAIN) Evaluator’s Handbook: Practical Guidelines for Using GAIN Data To Support Local and Cross-Site Program Evaluation and Development Michael Dennis, Melissa Ives, & Rodney Funk Chestnut Health Systems, Bloomington, IL Joint Meeting on Adolescent Treatment Effectiveness, April 25-27, 2007, Washington, DC
Objectives • Identify common questions used in evaluations and available GAIN tools and reports. • Understand how to respond to these questions using GAIN data, tools and reports. • Identify and answer questions that will help you use GAIN to support program evaluation and development. • Get your input on what would be most useful to have in the GAIN Evaluators Handbook
Questions • We will encourage you to ask questions as we go if something is not clear • We are handing out note cards to get more detailed questions to answer at the end. If you put your e-mail or address on them (or sign up) we will send you copies of our answers in writing. • Are there anything you are specifically here for that you want us to be sure and cover?
Common Questions in Local Program Evaluation and Clinical Research • Who is being served? • What services are they receiving? • To what extent are services being targeted at the those in need? • To what extent are services being delivered as expected? (Performance/Fidelity) • Which is most effective of several services delivered? • What does it cost, cost effectiveness? Source: Dennis, Fetterman & Sechrest (1994)
GAIN Scales & Variable File • Purpose • Type of Measure • Interpretative Cut Points • Description • Syntax • References • Items • Summarizing in a table
Purpose • Diagnosis based on APA • Treatment planning based on CARF, COA, JCAHO, NIDA principals and SAMHSA TIPs • Placement based on ASAM and statistical models • Covariates based on lifetime or past year measures • Change Scores based on past 90 days, month, week or current status or time since last event • Methods Measures • Economic Measures
Types of Measures • Scale: a set of “symptoms” or items that are inter-correlated (e.g.., dependence, depression) where we are interested in the pattern (i.e. Common variance, ONLY one where alpha makes sense) • Index: a set of items that may not be directly related but add up to predict (e.g., sources of stress, barriers to treatment, expenses) • Ratio Estimators: one measure divided by another (e.g.., percent of unprotected sex acts) • Status measures: a categorical status based on a single question or created across multiple (e.g.., vocational status, housing status) • Survival: Time to first event (e.g. time to first use)
Interpretative Cut-Points • Definition of low, moderate and high clinical significance bands to aid interpretation and decision making (scale name + “g” for group) • Useful for defining need at both the client and program level • Basis • DSM or other clinical standards where available (e.g.., clinical is 3+/7 dependence) • 50th & 90th percentile for common issues (e.g. days of alcohol use) • 1+ and median of 1+ for zero saturated (more than half) and right skewed variables • Reversed coded if “up” is low clinical significance
Descriptions • GAIN-I S&V excel file has text based descriptions, literal syntax (including older version if applicable), items, and references • GAIN main scales and indexes word file includestext to put in a journal article or report, including: - short definition - any subscales - source of measure - key reports/citations - alphas for adolescents and adults if applicable 3. The articles in the GAIN bibliography (many of which are included on the CD) have more details as well.
Possible Comparison Groups • published data • site over time • subsites, staff, or clinics • compare site to larger program (all sites) • compare site to similar level of care, geography, demographic subgroup, or clinical subgroup • match clinical subgroups from GAIN related presentations or papers • formal matching or propensity scoring to make groups more statistically comparable • formal randomized experiments • path or mediation models to test whether it is actually the dosage or key ingredient driving the change
Major Predictors of Effective Programs that we have to be cognizant of.. • An explicit intervention protocol (typically manualized) that a priori evidence that it works when followed • Use of monitoring, feedback, supervision and quality assurance to ensure protocol adherence and project implementation • Use proactive case supervision at the individual level to ensure quality of care • Triage to focus on the higher severity subgroups of individuals
No problems (0-25%ile) 1-3 problems (25-50%ile) 4-8 problems (50-75%ile) 9+ problems (75-100%ile) Impact of Intake Severity on Outcome 10 SPSM groupings OVERALL 8 6 Substance Problem Scale (0-16 Past Month Symptoms) 4 Dot/Lines show Means 2 Intake Severity Correlated -.66 with amount of change 0 0 6 Wave Source: ATM Main Findings data set
Different than Regression to the Mean 10 SPSM groupings OVERALL 8 No problems (0-25%ile) 1-3 problems (25-50%ile) 6 Substance Problem Scale (0-16 Past Month Symptoms) 4-8 problems (50-75%ile) 4 9+ problems (75-100%ile) Dot/Lines show Means 2 In its most basic form, the mean & variance are the same at both time points; no correlation between intake & amount of change 0 0 6 Wave Source: ATM Main Findings data set
Different than Regression to the Mean 10 SPSM groupings OVERALL 8 No problems (0-25%ile) 1-3 problems (25-50%ile) 6 Substance Problem Scale (0-16 Past Month Symptoms) 4-8 problems (50-75%ile) 4 9+ problems (75-100%ile) Dot/Lines show Means 2 If it was regression around the mean combined with an mean effect it would; but still no change in variance or correlation between intake & amount of change 0 0 6 Wave Source: ATM Main Findings data set
0.27 0.20 0.15 0.10 0.01 0.00 0.00 -0.04 -0.08 -0.29 -0.39 -0.69 Example of Multi-dimensional HIV Subgroups 0.40 0.20 0.00 -0.02 -0.03 -0.10 Cohen's Effect Size d -0.20 -0.40 Unprotected Sex Acts (f=.14) Days of Victimization (f=.22) -0.60 Days of Needle Use (f=1.19) -0.80 A. B. C. D. Total Low Risk Mod. Risk Low Mod. Risk High Very High Risk W/T W/T Source: Lloyd et al 2007
Key things to Test and Monitor • Assumptions about population characteristics and needs (using site profiles) • Comparability of comparison groups (using site profiles) • Simple performance measures and early outcomes for monitoring implementation • Measure of competence, fidelity and implementation • Variability in outcomes by subgroup
Melissa Ives • Melissa will now demonstrate how to use some of the data and tools we provide to do these things.
GAIN Evaluator’s Handbook:Resources for answering'Who is being served?' Melissa L. Ives, MSW Research Associate Chestnut Health Systems Lighthouse Institute GAIN Coordinating Center Joint Meeting on Adolescent Treatment Effectiveness, April 25-27, 2007, Washington, DC
Introduction and goals • The first of the 5 key questions is • Who is being served? • Two goals of this portion of the presentation: • Identify tools that are already available from the GCC. • Explore the use of one key tool for examining characteristics of those being served. • Always our goal: To answer your questions. • Be sure to write down any questions that are not answered during the presentation. • Answers to these questions will be used to enhance the Evaluator’s Handbook.
Overview • It is always easier to use the right tool than to create a new one • especially if the tool is readily available. • I used the AutoContent Wizard provided by PowerPoint to create these slides. • The GCC currently provides several tools to support evaluators or analysts in answering the key questions.
Tools Electronic Encyclopedia (GI S&V) GAIN-I / M90 data Site Profiles Evaluator Or Analyst LI Analytic Training Series Memos Syntax & template files TTL Report FUL Report Adult & Adolescent Norms
Site Profiles • Excel file containing information about the characteristics of clients being served. • Aggregated by site within a program or study. • Contents: • Title page – defining what groups are included (with grant numbers as acknowledgement) and what time period is covered. • Chart Options – Interactive tab to select desired site(s) included in graphs. • Table of Contents – list of graph • Single site charts • Two-group comparison charts • Data tables • Worksheets
Site Profiles • Provided quarterly for CSAT Programs on the APSS website. • Can be created as <varname> Profiles (based on a variable other than site). • A version for Level of Care is provided on today’s CD.
Example from ESD 113: Olympia, WA • EAT site with additional GAIN data from 2 other locations. • Interested in examining one of these locations in comparison with the rest of their own EAT site and with the whole EAT program. • Used the SPSS syntax and template in Excel Open ESD Site ProfilesOpen ESD Presentation
Summary • At this point you should: • Be aware of the existence of several tools to assist you in understanding who is being served. • Be able to find information about tools you want to use. • Be excited about how you can use these tools for your own analysis. • NOT be worried if you still have questions! • WRITE any questions on your index card. • For a direct reply after this meeting: • Write legibly and include your name and e-mail address.
Where to Get More Information • Our website: • http://www.chestnut.org/li/ • FTP Common Site: Evaluator’s Folder • ftp://data.chestnut.org • Username: Common • Password: public • Send e-mail to: • GAINEval@chestnut.org
APSS GAIN Information LI Analytic Training Series Presentations and Posters Information about CHS studies
GAIN Instrument: Archive APSS Data Sharing Agreements Norms, Naming Conventions, & GAIN-I Scales and Variables file!!
Where to Get More Information • Our website: • http://www.chestnut.org/li/ • FTP Common Site: Evaluator’s Folder • ftp://data.chestnut.org • Username: Common • Password: public • Send e-mail to: • GAINEval@chestnut.org
Examples of Analysis Using GAIN Data Rod Funk Chestnut Health Systems, Bloomington, IL
Acknowledgement: This presentation was developed under contract #270-2003-00006 from the Center for Substance Abuse Treatment (CSAT) of the Substance Abuse and Mental Health Services Administration (SAMHSA) and presents data from the Persistent Effects of Treatment Study (PETS, Contract No. 270-97-7011) and the Cannabis Youth Treatment (CYT) Cooperative Agreement (Grant Nos. TI11317, TI11320, TI11321, TI11323, and TI11324) as well as the Assertive Continuing Care Study supported by funds and data from the National Institute on Alcoholism & Alcohol Abuse (RO1 AA 10368). The opinions are those of the authors and do not reflect official positions of the government.
Treatment Outcome Difference between intake and average of all short term follow-ups (3-12) Long Term Stability Difference between average of short term follow-ups (3-12) and long term follow-up (30) Short Term Outcome Stability Difference between average of early (3-6) and latter (9-12) follow-up interviews Evaluating the Effects of Treatment Month Z-Score Source: Dennis et al, 2003, 2004
Treatment Outcome: • Use reduced (-34%) • No Sig. Dif. by condition • Long Term Stability: • - Use increases (+64%) • No Sig. Dif. by condition Short Term Stability: - Outcomes stable (-1%) - No Sig. Dif. by condition Change in Substance Frequency Scale in CYT Experiment 1: Incremental Arm Months from Intake Source: Dennis et al, CPDD, 2003
Treatment Outcome: • Use reduced (-35%) • No Sig. Dif. by condition • Short Term Stability: • Further reductions (-6%) • Sig. Dif. by condition • (+4% vs. –10% vs. –11%) • Long Term Stability: • - Outcomes stable (+20%) • No Sig. Dif. by condition Change in Substance Frequency Scale inCYT Experiment 2: Alternative Arm Months from Intake Source: Dennis et al, CPDD 2003
Less than average for 6 weeks Less than average for 12 weeks $3,495 $1,776 NTIES Est (6.7 weeks) NTIES Est.(13.1 weeks) Average Episode Cost ($US) of Treatment |--------------------------------------------Economic Cost-------------------------------------------|-------- Director Estimate-----| $4,000 $3,322 $3,500 $3,000 $2,500 Average Cost Per Client-Episode of Care $1,984 $2,000 $1,559 $1,413 $1,500 $1,197 $1,126 $1,000 $500 $- ACRA (12.8 weeks) MET/CBT5 (6.8 weeks) MET/CBT5 (6.5 weeks) MET/CBT12 (13.4 weeks) FSN (14.2 weeks w/family) MDFT(13.2 weeks w/family) Source: French et al., 2002, 2003
Stability of MET/CBT-5 findings mixed at 30 months MET/CBT-5, -12 and ACRA more cost effective at 12 months Integrated family therapy (MDFT) was more cost effective than adding it on top of treatment (FSN) at 30 months Cost Per Person in Recovery at 12 and 30 Months After Intake by CYT Condition Experiment 1 (n=299) Experiment 2 (n=297) Cost Per Person in Recovery (CPPR) $30,000 ACRA Effect Largely Sustained $25,000 $20,000 $15,000 $10,000 $5,000 $0 MET/ CBT5 MET/ CBT12 FSNM MET/ CBT5 ACRA MDFT $6,437 $10,405 $24,725 $27,109 $8,257 $14,222 CPPR at 12 months** $3,958 $7,377 $15,116 $6,611 $4,460 $11,775 CPPR at 30 months* * P<.0001, Cohen’s f= 1.42 and 1.77 at 12 months ** P<.0001, Cohen’s f= 0.76 and 0.94 at 30 months Source: Dennis et al., 2004; 2005
The effects of adolescent treatment are mediated by the extent to which they lead to actual changes in the recovery environment or peer group Environmental Factors are also the Major Predictors of Relapse AOD use in the home, family problems, homelessness, fighting, victimization, self help group participation, structure activities Baseline Family .32 .77 .18 Conflict Recovery Environment -.54 Risk -.13 .17 .58 .74 Family .22 .32 Substance- -.09 Cohesion Substance .43 Related Use Problems .32 .82 .19 .11 Social Social .19 -.08 .22 Support Risk Baseline Baseline Model Fit CFI=.97 to .99 by follow-up wave RMSEA=.04 to .06 by wave Peer AOD use, fighting, illegal activity, treatment, recovery, vocational activity .21 Baseline Source: Godley, Kahn et al (2005)
Sustained Abstinence Early Abstinence General Continuing Care Adherence Relative to UCC, ACC will increase General Continuing Care Adherence (GCCA) GCCA (whether due to UCC or ACC) will be associated with higher rates of early abstinence Early abstinence will be associated with higher rates of long term abstinence. Assertive Continuing Care (ACC) Hypotheses Assertive Continuing Care
UCC ACC * p<.05 ACC Improved General Continuing Care Adherence (GCCA) 100% 20% 30% 10% 40% 50% 60% 70% 80% 90% 0% Weekly Tx Weekly 12 step meetings Relapse prevention* Communication skills training* Problem solving component* Regular urine tests Meet with parents 1-2x month* Weekly telephone contact* Contact w/probation/school Referrals to other services* Follow up on referrals* Discuss probation/school compliance* Adherence: Meets 7/12 criteria* Source: Godley et al 2002, 2007
ACC ACC was associated with Reduced Relapse 1.0 .9 ACC almost doubled the time before relapse and reduce long term relapse .8 .7 .6 Proportion Remaining Abstinent from Marijuana .5 .4 .3 .2 UCC .1 0.0 0 30 60 90 120 150 180 210 240 270 Days to First Marijuana Use p<.05 Source; Godley et al 2002
55% 55% 43% High (7-12/12) GCCA * p<.05 GCCA Improved Early (0-3 mon.) Abstinence 100% Regardless of condition 90% 80% 70% 60% 50% 38% 36% 40% 30% 24% 20% 10% 0% Any AOD (OR=2.16*) Alcohol (OR=1.94*) Marijuana (OR=1.98*) Low (0-6/12) GCCA Source: Godley et al 2002, 2007
73% 69% 59% Early (0-3 mon.) Abstainer * p<.05 Early (0-3 mon.) Abstinence Improved Sustained (4-9 mon.) Abstinence 100% 90% 80% 70% 60% 50% 40% 30% 22% 22% 19% 20% 10% 0% Any AOD (OR=11.16*) Alcohol (OR=5.47*) Marijuana (OR=11.15*) Early(0-3 mon.) Relapse Source: Godley et al 2002, 2007
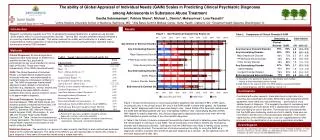
Traumatized groups have higher severity High trauma group does not respond to OP Both groups respond to residential treatment Victimization and Level of Care Interact to Predict Outcomes CHS Outpatient CHS Residential 40 35 30 25 Marijuana Use (Days of 90) 20 15 10 5 0 Intake 6 Months Intake 6 Months OP -High OP - Low/Mod Resid-High Resid - Low/Mod. Source: Funk, et al., 2003
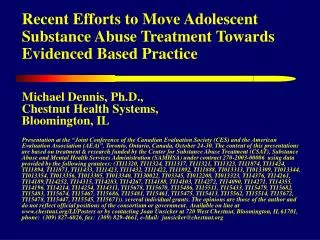
Other programs serve clients who have significantly higher severity And on average they have moderate effect sizes even with high GVS Green line is CHS OP’s High GVS adolescents; they have some initial gains but substantial relapse How do CHS OP’s high GVS outcomes compare with other OP programs on average? 1.00 CYT Total (n=217; d=0.51) 0.80 0.60 ATM Total (n=284; d=0.41) 0.40 CHSOP (n=57; d=0.18) 0.20 Z-Score on Substance Frequency Scale (SFS) 0.00 -0.20 -0.40 -0.60 -0.80 -1.00 Intake Mon 1-3 Mon 4-6 Mon 7-9 Mon 10-12 Source: CYT and ATM Outpatient Data Set, Dennis 2005
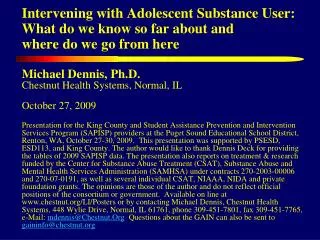
The two best were used with much higher severity adolescents and TDC was not manualized 7 Challenges (n=42; d=1.21) Tucson Drug Court (n=27; d=0.65) MET/CBT5a (n=34; d=0.62) MET/CBT5b (n=40; d=0.55) FSN/MET/CBT12 (n=34; d=0.53) CHSOP (n=57; d=0.18) Next we can check to see if they are any more similar in severity Which 5 OP programs did the best with high GVS adolescents? 1.00 0.80 0.60 0.40 0.20 Z-Score on Substance Frequency Scale (SFS) 0.00 -0.20 -0.40 -0.60 -0.80 Currently CHS is doing an experiment comparing its regular OP with MET/CBT5 -1.00 Intake Mon 1-3 Mon 4-6 Mon 7-9 Mon 10-12 Source: CYT and ATM Outpatient Data Set, Dennis 2005
Methodological Issues to Be Aware of.. • Site differences: Beware of demographic differences between sites, such as on gender and race. You can use cluster analysis to create homogeneous subgroups or propensity scores to create more equivalent groups. • Floor & Ceiling Effects: Check distributions of outcome variables. If wanting to look at needle use, there is very little to begin with in the CSAT data which would make it difficult to look at change over time. • Non-normal distributions: A lot of variables used for outcome analysis can be very zero saturated and therefore highly right skewed.
Methodological Issues Continued.. • Co-Occurring Disorders: Beware that adolescents are more than likely presenting for more problems than just substance use, such as internal and external disorders. • Controlled Environment: Be sure to check for days in controlled environment. You may need to adjust your outcomes, such as days of abstinence. You could subtract days in a controlled environment from your dependent variable, use it as another outcome variable or use it as a covariate in your analysis
References Dennis, M. (2005). State of the art of treating adolescent substance use disorders: Course, treatment system, and evidence based practices. Paper presented at the 2005 State Adolescent Coordinators (SAC) Grantee Orientation Meeting, Baltimore, MD. http://www.chestnut.org/LI/Posters Dennis, M. L., Godley, S. H., Diamond, G., Tims, F. M., Babor, T., Donaldson, J., Liddle, H., et al. (2004). The Cannabis Youth Treatment (CYT) study: Main findings from two randomized trials.Journal of Substance Abuse Treatment, 27, 197–213. Dennis, M. L., et al. (2003).Cannabis Youth Treatment Experiment: 12 and 30 Month Findings. Presentation at College of problems of Drug Dependence, Bal Harbour, FL. http://www.chestnut.org/LI/Posters French, M.T., Roebuck, M.C., Dennis, M.L., Diamond, G., Godley, S.H., Tims, F., Webb, C., & Herrell, J.M. (2002). The economic cost of outpatient marijuana treatment for adolescents: Findings from a multisite experiment. Addiction, 97, S84-S97. French, M. T., Roebuck, M. C., Dennis, M. L., Diamond, G., Godley, S. H., Liddle, H. A., and Tims, F. M. (2003). Outpatient marijuana treatment for adolescents Economic evaluation of a multisite field experiment. Evaluation Review,27(4)421-459. Funk, R. R., McDermeit, M., Godley, S. H., & Adams, L. (2003). Maltreatment issues by level of adolescent substance abuse treatment The extent of the problem at intake and relationship to early outcomes. Journal of Child Maltreatment, 8, 36-45. Godley, M. D., Godley, S. H., Dennis, M. L., Funk, R., & Passetti, L. (2002). Preliminary outcomes from the assertive continuing care experiment for adolescents discharged from residential treatment. Journal of Substance Abuse Treatment, 23, 21-32. Godley, M. D., Godley, S. H., Dennis, M. L., Funk, R. R., & Passetti, L. L. (2007). The effect of Assertive Continuing Care on continuing care linkage, adherence, and abstinence following residential treatment for adolescents with substance use disorders. Addiction, 102,81-93. Godley, M. D., Kahn, J. H., Dennis, M. L., Godley, S. H., & Funk, R. R. (2005). The stability and impact of environmental factors on substance use and problems after adolescent outpatient treatment. Psychology of Addictive Behaviors, 19, 62-70.