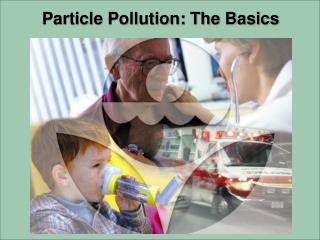
Particle Pollution: The Basics
130 likes | 299 Vues
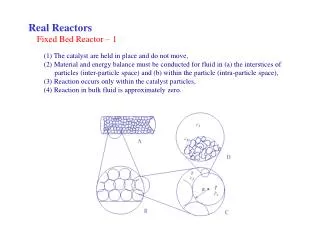
Particle Pollution: The Basics. An average grain of table salt is 100 micrometers across (100 µm). PM 10 ( 10µm ). PM 2.5 (2.5 µ m). What is particle pollution?. Particle pollution is a complex mixture of extremely small particles and liquid droplets.

Particle Pollution: The Basics
E N D
Presentation Transcript
An average grain of table salt is 100 micrometers across (100 µm) PM10 (10µm) PM2.5 (2.5 µm) What is particle pollution? • Particle pollution is a complex mixture of extremely small particles and liquid droplets. • Some of these particles – called fine particles – are just 2.5 micrometers in diameter. That’s 40 times smaller than the average grain of table salt! • The size of particles is directly linked to their potential for causing health problems. • Particle pollution also contributes to reduced visibility, or haze. The particles in particle pollution are so small, you can’t see just one of them ...
Many sources; occurs year-round • Particle pollution comes from a variety of sources, including: • wind-blown dust (larger particles) • combustion sources • cars and trucks • industry • power plants • fires • Fine particlescan be emitted directlyinto the air, or they can form from gasesthat react in the atmosphere. • Particle pollution can occur year-round -- and may be worse in the fall and winter, depending on where you live.
Particle pollution affects your lungs • You are exposed to particle pollution simply by breathing polluted air. • Exposure increases when you exercise, because you breathe more vigorously and deeply than usual. • People exposed to particles may experience a number of respiratory symptoms, including: • airway irritation; • cough; • phlegm; • decreased lung function; • airway inflammation; • asthma attacks; and • chronic bronchitis Particle pollution can penetrate into the part of your lungs known as the alveoli, which deliver oxygen to the bloodstream.
And particle pollution affects your heart • Particle pollution has been linked to changes that indicate your heart isn’t as healthy as it should be. Those include: • Arrhythmiasand changes in heart rate. • Changes in the variability of your heart rate.Your heart rate should increase, for example, when you run and return to normal when you sit quietly. Decreased variability is a risk factor for heart attacks. • Blood component changesthat signal inflammation, and increased likelihood of potential blood clots, which can lead to heart attacks. • Some studies have shown that particle exposure causes heart attacks. And particles are linked with death from heart disease. Particle exposure has been linked to heart attacks.
Some groups are at greater risk • People with heart or lung diseases are more vulnerable to particle pollution because of their conditions (such as congestive heart disease, coronary artery disease, asthma, or chronic obstructive pulmonary disease.) • Older adultsalso are considered at risk, because they are more likely to have heart and lung disease. (Sometimes that disease hasn’t been diagnosed yet.) • Childrenare at risk (primarily from chronic exposure), because they are more likely to be active, they breathe more air per pound of body weight than adults, and their bodies are still developing.
It’s a public health concern • Whenparticles aggravate heart and lung diseases, that, in turn, means increases in: • Hospital admissions • Doctor and emergency room visits • Medication use; and • Absences from work or school. • Particle pollution is linked to significant public health risks – including premature deathfrom heart and lung disease.
And it damages the view • High concentrations of fine particles are a major contributor to haze. • Haze dramatically reduces visibility. In the West, a normal “visual range” is about 140 miles when it’s clear. Because of haze, the current range is 33 to 90 miles. • In the East, a normal range is 90 miles (it’s shorter in the East because of higher humidity). Haze has cut that range to 14 to 24 miles – and in the summer, often to less than 10! The pictures above show the difference between clear and hazy days in Chicago in the summer of 2000. Both photos were taken from the same location.
Reducing particle pollution • Reducing particle pollution, especially fine particles, is an EPA priority. • U.S. is making progress • From 1999 to 2002, annual average fine particle concentrations decreased 8 percent nationwide. • Much reduction was in the Southeast (18 percent decrease). • But there’s more to do. • 120 counties – home to 50 million people -- still do not meet fine particle standards.
EPA’s PM reduction efforts • The Clear Skies Act of 2003, which will dramatically cut pollution from power plants and will significantly reduce fine particle pollution. • National air quality standards for fine particles, with compliance deadlines beginning 2007. • New tailpipe standards for passenger vehicles and on-road heavy-duty diesel engines, starting with 2004 model year. • Proposed tough standards to reduce emissions from the heavy-duty engines used in non-road vehicles. • Diesel retrofit programs, including the Clean School Bus initiative and programs to retrofit diesel trucks.
Check AQI forecasts to protect your health • You can takesimple steps to protect yourselffrom particle pollution. • Get in the habitof checking your local Air Quality Index forecast every day. • When particle pollution levels are predicted to be high,change your plansto reduce the amount of pollution that gets in your lungs. AQI forecasts tell you whether particle levels are expected to be high – and suggests steps you can take to protect yourself. Those steps vary, depending on whether you’re in one of the groups more at risk from particle exposure.
AQI color code Who is affected? What is the significance? What action should people take? Green __ Air quality is good Enjoy activities Yellow People who are unusually sensitive to air pollution Air quality is a concern for people who are unusually sensitive to air pollution People unusually sensitive to air pollution: Plan strenuous activities when air quality is better Orange People with heart or lung disease (including asthma), older adults, and children Air quality is unhealthy for people in sensitive groups Sensitive groups: Cut back or reschedule strenuous activities Red Everyone, especially people with heart or lung disease (including asthma), older adults, and children Air quality is unhealthy for everyone Everyone: Cut back or reschedule strenuous activities Sensitive groups: Avoid strenuous activities Purple Everyone, especially people with heart or lung disease (including asthma), older adults, and children Air quality is very unhealthy for everyone Everyone: Significantly cut back on physical activities Sensitive groups: Avoid all physical activities Who needs to protect themselves? How? The table at left recommends taking protective actions at different levels of particle pollution. These messages apply to particle pollution only. For information about protecting yourself from ozone, or a combination of ozone and particles, go to www.epa.gov/airnow/
EPA’s AIRNow web site includes links to daily particle pollution forecasts – and information on how you can use those forecasts to protect yourself. AQI Contacts: For mediaAlison Davis 919-541-7587 davis.alison@epa.gov For outreach materials Debbie Stackhouse 919-541-5354 stackhouse.debbie@epa.gov For health professionals Susan Stone 919-541-1146 stone.susan@epa.gov For meteorologists Richard "Chet" Wayland 919-541-4603 wayland.richard@epa.gov