Download
1 / 34
340 likes | 477 Vues
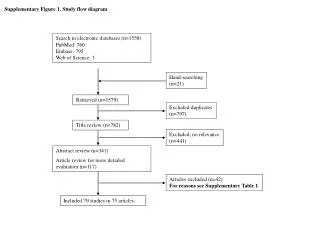
Supplementary Figure 1. Study flow diagram. Search in electronic databases (n=1558) PubMed: 760 Embase: 795 Web of Science: 3. Hand-searching (n=21). Retrieved (n=1579). Excluded duplicates (n=797). Title review (n=782). Excluded; no relevance (n=441). Abstract review (n=341)

E N D
Supplementary Figure 1. Study flow diagram Search in electronic databases (n=1558) PubMed: 760 Embase: 795 Web of Science: 3 Hand-searching (n=21) Retrieved (n=1579) Excluded duplicates (n=797) Title review (n=782) Excluded; no relevance (n=441) Abstract review (n=341) Article review for more detailed evaluation (n=117) Articles excluded (n=42) For reasons see Supplementary Table 1 Included 79 studies in 75 articles
Supplementary Figure 2. Detailed meta-analysis of Arg702Trp on the basis of allele frequencies. Crohn’s disease. All studies. Study Crohn’s disease Weight, % OR (95% CI) Karban A (2005) 5.58 (0.23, 137.89) 5.58 (0.23, 137.89) 0.09 0.09 Kugathasan S (2005) 0.44 (0.02, 7.89) 0.44 (0.02, 7.89) 0.12 0.12 Kugathasan S (2005) 0.53 (0.06, 4.80) 0.53 (0.06, 4.80) 0.20 0.20 Zouiten-Mekki L (2005) 3.51 (0.41, 30.30) 3.51 (0.41, 30.30) 0.20 0.20 Ince AT (2008) 0.16 (0.02, 1.26) 0.16 (0.02, 1.26) 0.22 0.22 Tukel T (2004) 6.71 (1.04, 43.16) 6.71 (1.04, 43.16) 0.27 0.27 Ozen SC (2006) 0.75 (0.14, 4.17) 0.75 (0.14, 4.17) 0.32 0.32 Vavassori P (2004) 1.52 (0.28, 8.37) 1.52 (0.28, 8.37) 0.32 0.32 Torkvist L (2006) 6.68 (1.52, 29.31) 6.68 (1.52, 29.31) 0.41 0.41 Canto E (2007) 6.59 (1.52, 28.55) 6.59 (1.52, 28.55) 0.42 0.42 Gazouli M (2004) 11.00 (2.57, 47.14) 11.00 (2.57, 47.14) 0.42 0.42 Tomer G (2003) 5.47 (1.48, 20.16) 5.47 (1.48, 20.16) 0.52 0.52 Jess T (2005) 3.76 (1.11, 12.80) 3.76 (1.11, 12.80) 0.58 0.58 Zaahl MG (2005) 2.10 (0.62, 7.08) 2.10 (0.62, 7.08) 0.59 0.59 Crawford NPS (2007) 5.50 (1.67, 18.18) 5.50 (1.67, 18.18) 0.60 0.60 Bene J (2006) 1.89 (0.58, 6.10) 1.89 (0.58, 6.10) 0.62 0.62 Derakhshan F (2008) 9.51 (3.00, 30.16) 9.51 (3.00, 30.16) 0.64 0.64 Economou M (2007) 3.85 (1.25, 11.93) 3.85 (1.25, 11.93) 0.66 0.66 Karban A (2004) 4.13 (1.38, 12.34) 4.13 (1.38, 12.34) 0.70 0.70 Buhner S (2006) 3.15 (1.06, 9.32) 3.15 (1.06, 9.32) 0.71 0.71 Karban A (2005) 4.24 (1.46, 12.30) 4.24 (1.46, 12.30) 0.73 0.73 Rigoli L (2008) 4.36 (1.64, 11.55) 4.36 (1.64, 11.55) 0.85 0.85 Lappalainen M (2008) 2.15 (0.83, 5.55) 2.15 (0.83, 5.55) 0.89 0.89 Vind I (2005) 1.01 (0.41, 2.49) 1.01 (0.41, 2.49) 0.96 0.96 Vermeire S (2002) 3.38 (1.43, 8.01) 3.38 (1.43, 8.01) 1.04 1.04 Ferraris A (2006) 4.51 (1.91, 10.64) 4.51 (1.91, 10.64) 1.04 1.04 Tukel T (2004) 2.11 (0.92, 4.84) 2.11 (0.92, 4.84) 1.09 1.09 Nagy Z (2005) 2.30 (1.00, 5.27) 2.30 (1.00, 5.27) 1.10 1.10 van der Linde K (2007) 1.53 (0.68, 3.45) 1.53 (0.68, 3.45) 1.13 1.13 Cottone M (2006) 2.98 (1.33, 6.70) 2.98 (1.33, 6.70) 1.14 1.14 Rodrigo L (2007) 0.79 (0.36, 1.72) 0.79 (0.36, 1.72) 1.20 1.20 Magyari L (2009) 1.41 (0.66, 3.03) 1.41 (0.66, 3.03) 1.24 1.24 Helio T (2003) 1.84 (0.86, 3.93) 1.84 (0.86, 3.93) 1.25 1.25 Buning C (2005) 2.81 (1.33, 5.92) 2.81 (1.33, 5.92) 1.29 1.29 Hugot JP (2001) 3.06 (1.47, 6.39) 3.06 (1.47, 6.39) 1.31 1.31 Heresbach D (2004) 2.60 (1.25, 5.43) 2.60 (1.25, 5.43) 1.31 1.31 Mendoza JL (2003) 3.52 (1.70, 7.26) 3.52 (1.70, 7.26) 1.34 1.34 Cukovic-Cavak S (2006) 2.79 (1.35, 5.76) 2.79 (1.35, 5.76) 1.34 1.34 Russel RK (2005) 1.19 (0.58, 2.43) 1.19 (0.58, 2.43) 1.37 1.37 Zhou Z (2002) 1.13 (0.56, 2.26) 1.13 (0.56, 2.26) 1.42 1.42 Diego CD (2006) 2.29 (1.15, 4.58) 2.29 (1.15, 4.58) 1.43 1.43 Braat H (2005) 2.89 (1.47, 5.65) 2.89 (1.47, 5.65) 1.49 1.49 Bianchi V (2007) 1.79 (0.94, 3.42) 1.79 (0.94, 3.42) 1.57 1.57 Nunez C (2004) 1.17 (0.62, 2.20) 1.17 (0.62, 2.20) 1.61 1.61 Baptista ML (2008) 3.77 (2.00, 7.10) 3.77 (2.00, 7.10) 1.61 1.61 Lakatos PL (2005) 2.55 (1.37, 4.73) 2.55 (1.37, 4.73) 1.66 1.66 Gearry RB (2007) 2.59 (1.41, 4.76) 2.59 (1.41, 4.76) 1.69 1.69 Leung E (2005) 1.47 (0.80, 2.69) 1.47 (0.80, 2.69) 1.71 1.71 Giachino D (2004) 1.56 (0.89, 2.76) 1.56 (0.89, 2.76) 1.85 1.85 Annese V (2005) 2.20 (1.26, 3.85) 2.20 (1.26, 3.85) 1.88 1.88 Newman B (2004) 2.26 (1.31, 3.90) 2.26 (1.31, 3.90) 1.93 1.93 Arnot IDR (2004) 1.48 (0.88, 2.51) 1.48 (0.88, 2.51) 2.02 2.02 Vermeire S (2004) 2.94 (1.74, 4.96) 2.94 (1.74, 4.96) 2.03 2.03 Brant SR (2007) 3.49 (2.08, 5.86) 3.49 (2.08, 5.86) 2.05 2.05 Protic MB (2007) 1.50 (0.90, 2.50) 1.50 (0.90, 2.50) 2.08 2.08 de Ridder L (2007) 2.96 (1.77, 4.93) 2.96 (1.77, 4.93) 2.08 2.08 Cuthbert AP (2002) 2.72 (1.64, 4.50) 2.72 (1.64, 4.50) 2.11 2.11 Kugathasan S (2005) 1.26 (0.76, 2.07) 1.26 (0.76, 2.07) 2.14 2.14 Cucchiara S (2007) 3.01 (1.83, 4.95) 3.01 (1.83, 4.95) 2.14 2.14 Esters N (2004) 2.42 (1.48, 3.97) 2.42 (1.48, 3.97) 2.16 2.16 Ferreira AC (2005) 3.31 (2.03, 5.38) 3.31 (2.03, 5.38) 2.20 2.20 Sugimura K (2003) 1.73 (1.10, 2.73) 1.73 (1.10, 2.73) 2.35 2.35 Bonen DK (2003) 1.95 (1.26, 3.04) 1.95 (1.26, 3.04) 2.42 2.42 Hradsky O (2008) 1.48 (0.95, 2.30) 1.48 (0.95, 2.30) 2.43 2.43 Oostenbrug LE (2006) 1.88 (1.21, 2.92) 1.88 (1.21, 2.92) 2.44 2.44 Riss L (2007) 2.31 (1.50, 3.57) 2.31 (1.50, 3.57) 2.46 2.46 Ahmad T (2002) 2.63 (1.71, 4.04) 2.63 (1.71, 4.04) 2.48 2.48 Mascheretti S (2002) 2.05 (1.33, 3.14) 2.05 (1.33, 3.14) 2.50 2.50 Ernst A (2007) 2.02 (1.32, 3.09) 2.02 (1.32, 3.09) 2.50 2.50 Cavanaugh JA (2003) 2.35 (1.56, 3.56) 2.35 (1.56, 3.56) 2.57 2.57 Hampe J (2002) 2.72 (1.92, 3.84) 2.72 (1.92, 3.84) 2.97 2.97 Weersma RK (2009) 1.65 (1.33, 2.04) 1.65 (1.33, 2.04) 3.81 3.81 Random effect Fixed effect 2.24 (2.03, 2.48) 2.24 (2.03, 2.48) 2.21 (2.06, 2.37) .05 1 1 5 10 50 Odds ratio (95% CI)
Supplementary Figure 3. Detailed meta-analysis of Gly908Arg on the basis of allele frequencies. Crohn’s disease. All studies. Crohn’s disease Study OR (95% CI) Weight, % Zaahl MG (2005) 0.81 (0.03, 19.99) 0.81 (0.03, 19.99) 0.18 0.18 Lappalainen M (2008) 3.98 (0.19, 83.06) 3.98 (0.19, 83.06) 0.20 0.20 Kugathasan S (2005) 0.96 (0.05, 18.98) 0.96 (0.05, 18.98) 0.21 0.21 Helio T (2003) 7.79 (0.40, 151.18) 7.79 (0.40, 151.18) 0.21 0.21 Canto E (2007) 5.83 (0.32, 106.57) 5.83 (0.32, 106.57) 0.22 0.22 Russel RK (2005) 11.20 (0.64, 197.01) 11.20 (0.64, 197.01) 0.22 0.22 Torkvist L (2006) 12.30 (0.70, 216.21) 12.30 (0.70, 216.21) 0.22 0.22 Protic MB (2007) 20.60 (1.22, 347.57) 20.60 (1.22, 347.57) 0.23 0.23 Ince AT (2008) 0.65 (0.06, 7.21) 0.65 (0.06, 7.21) 0.31 0.31 Bene J (2006) 6.28 (0.78, 50.38) 6.28 (0.78, 50.38) 0.41 0.41 van der Linde K (2007) 9.88 (1.29, 75.93) 9.88 (1.29, 75.93) 0.42 0.42 Arnot IDR (2004) 7.10 (0.93, 54.19) 7.10 (0.93, 54.19) 0.43 0.43 Vermeire S (2002) 7.73 (1.04, 57.63) 7.73 (1.04, 57.63) 0.43 0.43 Jess T (2005) 2.31 (0.38, 14.24) 2.31 (0.38, 14.24) 0.52 0.52 Ozen SC (2006) 2.30 (0.38, 13.94) 2.30 (0.38, 13.94) 0.53 0.53 Derakhshan F (2008) 5.21 (0.94, 29.04) 5.21 (0.94, 29.04) 0.58 0.58 Karban A (2005) 1.87 (0.37, 9.39) 1.87 (0.37, 9.39) 0.64 0.64 Rodrigo L (2007) 1.20 (0.24, 5.99) 1.20 (0.24, 5.99) 0.65 0.65 Buhner S (2006) 2.63 (0.57, 12.19) 2.63 (0.57, 12.19) 0.70 0.70 Nagy Z (2005) 1.95 (0.43, 8.86) 1.95 (0.43, 8.86) 0.72 0.72 Cukovic-Cavak S (2006) 4.15 (0.92, 18.78) 4.15 (0.92, 18.78) 0.72 0.72 Vind I (2005) 3.11 (0.69, 14.06) 3.11 (0.69, 14.06) 0.72 0.72 Magyari L (2009) 8.20 (1.83, 36.73) 8.20 (1.83, 36.73) 0.73 0.73 Hugot JP (2001) 6.49 (1.57, 26.82) 6.49 (1.57, 26.82) 0.80 0.80 Tukel T (2004) 7.52 (1.90, 29.85) 7.52 (1.90, 29.85) 0.84 0.84 Crawford NPS (2007) 2.30 (0.66, 8.06) 2.30 (0.66, 8.06) 0.98 0.98 Heresbach D (2004) 2.37 (0.68, 8.28) 2.37 (0.68, 8.28) 0.99 0.99 Nunez C (2004) 5.19 (1.49, 18.10) 5.19 (1.49, 18.10) 0.99 0.99 Bianchi V (2007) 4.79 (1.37, 16.71) 4.79 (1.37, 16.71) 0.99 0.99 Cuthbert AP (2002) 6.71 (2.03, 22.14) 6.71 (2.03, 22.14) 1.06 1.06 Queiroz DM, (2009) 5.23 (1.61, 17.04) 5.23 (1.61, 17.04) 1.08 1.08 Diego CD (2006) 2.63 (0.83, 8.35) 2.63 (0.83, 8.35) 1.12 1.12 Buning C (2005) 2.58 (0.85, 7.77) 2.58 (0.85, 7.77) 1.20 1.20 Ferraris A (2006) 6.89 (2.33, 20.32) 6.89 (2.33, 20.32) 1.24 1.24 Mendoza JL (2003) 4.64 (1.62, 13.25) 4.64 (1.62, 13.25) 1.29 1.29 Zouiten-Mekki L (2005) 1.99 (0.70, 5.63) 1.99 (0.70, 5.63) 1.31 1.31 Baptista ML (2008) 1.20 (0.43, 3.33) 1.20 (0.43, 3.33) 1.35 1.35 Giachino D (2004) 3.17 (1.15, 8.76) 3.17 (1.15, 8.76) 1.36 1.36 Vavassori P (2004) 2.66 (0.97, 7.31) 2.66 (0.97, 7.31) 1.37 1.37 Vermeire S (2004) 2.10 (0.81, 5.42) 2.10 (0.81, 5.42) 1.50 1.50 Gearry RB (2007) 2.21 (0.86, 5.65) 2.21 (0.86, 5.65) 1.52 1.52 Cavanaugh JA (2003) 2.13 (0.85, 5.33) 2.13 (0.85, 5.33) 1.57 1.57 Cottone M (2006) 4.01 (1.61, 9.99) 4.01 (1.61, 9.99) 1.58 1.58 Ferreira AC (2005) 2.19 (0.90, 5.33) 2.19 (0.90, 5.33) 1.64 1.64 Rigoli L (2008) 1.03 (0.43, 2.50) 1.03 (0.43, 2.50) 1.65 1.65 Brant SR (2007) 4.06 (1.69, 9.73) 4.06 (1.69, 9.73) 1.68 1.68 Leung E (2005) 1.48 (0.62, 3.50) 1.48 (0.62, 3.50) 1.71 1.71 Esters N (2004) 3.43 (1.47, 7.97) 3.43 (1.47, 7.97) 1.76 1.76 Gazouli M (2004) 4.55 (1.97, 10.51) 4.55 (1.97, 10.51) 1.78 1.78 Riss L (2007) 1.21 (0.53, 2.76) 1.21 (0.53, 2.76) 1.80 1.80 Lakatos PL (2005) 1.76 (0.77, 4.02) 1.76 (0.77, 4.02) 1.81 1.81 Karban A (2004) 7.00 (3.12, 15.69) 7.00 (3.12, 15.69) 1.86 1.86 Karban A (2005) 5.76 (2.59, 12.81) 5.76 (2.59, 12.81) 1.89 1.89 Ahmad T (2002) 2.33 (1.05, 5.18) 2.33 (1.05, 5.18) 1.89 1.89 Economou M (2007) 0.84 (0.39, 1.79) 0.84 (0.39, 1.79) 2.00 2.00 Ernst A (2007) 1.55 (0.73, 3.29) 1.55 (0.73, 3.29) 2.03 2.03 Tomer G (2003) 1.96 (0.98, 3.93) 1.96 (0.98, 3.93) 2.23 2.23 Hampe J (2002) 5.72 (2.91, 11.25) 5.72 (2.91, 11.25) 2.29 2.29 Annese V (2005) 2.85 (1.46, 5.56) 2.85 (1.46, 5.56) 2.32 2.32 Kugathasan S (2005) 4.27 (2.23, 8.17) 4.27 (2.23, 8.17) 2.40 2.40 Tukel T (2004) 2.50 (1.30, 4.78) 2.50 (1.30, 4.78) 2.40 2.40 Newman B (2004) 1.52 (0.80, 2.91) 1.52 (0.80, 2.91) 2.40 2.40 Braat H (2005) 1.11 (0.59, 2.09) 1.11 (0.59, 2.09) 2.45 2.45 Zhou Z (2002) 1.57 (0.84, 2.94) 1.57 (0.84, 2.94) 2.49 2.49 Bonen DK (2003) 3.31 (1.80, 6.10) 3.31 (1.80, 6.10) 2.55 2.55 Cucchiara S (2007) 2.97 (1.63, 5.42) 2.97 (1.63, 5.42) 2.59 2.59 Hradsky O (2008) 2.82 (1.55, 5.12) 2.82 (1.55, 5.12) 2.61 2.61 Mascheretti S (2002) 2.52 (1.41, 4.51) 2.52 (1.41, 4.51) 2.68 2.68 Oostenbrug LE (2006) 1.42 (0.83, 2.45) 1.42 (0.83, 2.45) 2.85 2.85 de Ridder L (2007) 1.31 (0.78, 2.22) 1.31 (0.78, 2.22) 2.94 2.94 Sugimura K (2003) 1.58 (0.95, 2.63) 1.58 (0.95, 2.63) 3.00 3.00 Weersma RK (2009) 2.05 (1.49, 2.82) 2.05 (1.49, 2.82) 3.99 3.99 (Excluded) Kugathasan S (2005) 0.00 0.00 2.56 (2.23, 2.94) 2.56 (2.23, 2.94) Random effect Fixed effect 2.56 (2.31, 2.83) .05 1 5 10 50 Odds ratio (95% CI) Studies were excluded from meta-analysis if the risk allele/genotype was found neither in cases nor in controls.
Supplementary Figure 4. Detailed meta-analysis of Leu1007fsincC on the basis of allele frequencies. Crohn’s disease. All studies. . Crohn’s disease Study OR (95% CI) OR (95% CI) Weight, % Weight Karban A (2005) 5.58 (0.23, 137.89) 5.58 (0.23, 137.89) 0.13 0.13 Tukel T (2004) 49.85 (2.29, 1082.74) 49.85 (2.29, 1082.74) 0.14 0.14 Ozen SC (2006) 7.67 (0.37, 161.00) 7.67 (0.37, 161.00) 0.15 0.15 Zouiten-Mekki L (2005) 4.91 (0.25, 95.57) 4.91 (0.25, 95.57) 0.15 0.15 Guo QS (2004) 11.83 (0.72, 194.03) 11.83 (0.72, 194.03) 0.17 0.17 Protic MB (2007) 64.25 (3.92, 1052.26) 64.25 (3.92, 1052.26) 0.17 0.17 Kugathasan S (2005) 7.06 (0.43, 115.39) 7.06 (0.43, 115.39) 0.17 0.17 Ince AT (2008) 1.30 (0.08, 20.99) 1.30 (0.08, 20.99) 0.17 0.17 Kugathasan S (2005) 2.15 (0.13, 34.64) 2.15 (0.13, 34.64) 0.17 0.17 Zaahl MG (2005) 0.30 (0.04, 2.41) 0.30 (0.04, 2.41) 0.30 0.30 Canto E (2007) 4.26 (0.53, 34.53) 4.26 (0.53, 34.53) 0.30 0.30 Buhner S (2006) 18.74 (2.53, 138.87) 18.74 (2.53, 138.87) 0.32 0.32 Vermeire S (2002) 16.35 (2.24, 119.53) 16.35 (2.24, 119.53) 0.33 0.33 Derakhshan F (2008) 2.54 (0.35, 18.34) 2.54 (0.35, 18.34) 0.33 0.33 Roussomoustakaki M (2003) 1.82 (0.30, 11.07) 1.82 (0.30, 11.07) 0.39 0.39 Jess T (2005) 1.13 (0.24, 5.23) 1.13 (0.24, 5.23) 0.52 0.52 Queiroz DM, (2009) 26.98 (6.62, 109.87) 26.98 (6.62, 109.87) 0.61 0.61 Rodrigo L (2007) 1.75 (0.49, 6.21) 1.75 (0.49, 6.21) 0.72 0.72 Russel RK (2005) 3.51 (1.00, 12.37) 3.51 (1.00, 12.37) 0.73 0.73 Nunez C (2004) 5.19 (1.49, 18.10) 5.19 (1.49, 18.10) 0.74 0.74 Bene J (2006) 5.24 (1.52, 18.07) 5.24 (1.52, 18.07) 0.75 0.75 Bianchi V (2007) 5.80 (1.69, 19.89) 5.80 (1.69, 19.89) 0.75 0.75 Murillo L (2002) 9.27 (2.74, 31.36) 9.27 (2.74, 31.36) 0.77 0.77 van der Linde K (2007) 6.12 (1.81, 20.64) 6.12 (1.81, 20.64) 0.77 0.77 Leung E (2005) 10.91 (3.30, 36.08) 10.91 (3.30, 36.08) 0.79 0.79 Vavassori P (2004) 10.40 (3.17, 34.13) 10.40 (3.17, 34.13) 0.80 0.80 Annese V (2005) 13.97 (4.35, 44.87) 13.97 (4.35, 44.87) 0.82 0.82 Torkvist L (2006) 1.13 (0.35, 3.59) 1.13 (0.35, 3.59) 0.83 0.83 Baptista ML (2008) 4.56 (1.47, 14.08) 4.56 (1.47, 14.08) 0.87 0.87 Ferraris A (2006) 6.18 (2.08, 18.40) 6.18 (2.08, 18.40) 0.92 0.92 Radlmayr M (2002) 9.54 (3.28, 27.77) 9.54 (3.28, 27.77) 0.95 0.95 Nagy Z (2005) 4.03 (1.40, 11.55) 4.03 (1.40, 11.55) 0.97 0.97 Arnot IDR (2004) 3.86 (1.35, 11.03) 3.86 (1.35, 11.03) 0.97 0.97 Gearry RB (2007) 4.17 (1.50, 11.57) 4.17 (1.50, 11.57) 1.02 1.02 Hugot JP (2001) 6.86 (2.50, 18.83) 6.86 (2.50, 18.83) 1.03 1.03 Crawford NPS (2007) 2.95 (1.13, 7.72) 2.95 (1.13, 7.72) 1.11 1.11 Karban A (2004) 3.22 (1.28, 8.08) 3.22 (1.28, 8.08) 1.18 1.18 Lappalainen M (2008) 3.14 (1.26, 7.78) 3.14 (1.26, 7.78) 1.21 1.21 Rigoli L (2008) 3.61 (1.46, 8.95) 3.61 (1.46, 8.95) 1.21 1.21 Karban A (2005) 3.17 (1.30, 7.73) 3.17 (1.30, 7.73) 1.24 1.24 Diego CD (2006) 2.35 (0.96, 5.73) 2.35 (0.96, 5.73) 1.24 1.24 Vind I (2005) 2.63 (1.10, 6.32) 2.63 (1.10, 6.32) 1.27 1.27 Cottone M (2006) 4.26 (1.82, 9.98) 4.26 (1.82, 9.98) 1.32 1.32 Magyari L (2009) 5.10 (2.18, 11.94) 5.10 (2.18, 11.94) 1.32 1.32 Giachino D (2004) 2.88 (1.27, 6.53) 2.88 (1.27, 6.53) 1.39 1.39 Vermeire S (2004) 6.41 (2.87, 14.31) 6.41 (2.87, 14.31) 1.43 1.43 Cukovic-Cavak S (2006) 2.90 (1.30, 6.45) 2.90 (1.30, 6.45) 1.44 1.44 Heresbach D (2004) 2.26 (1.03, 4.95) 2.26 (1.03, 4.95) 1.47 1.47 Cavanaugh JA (2003) 7.54 (3.48, 16.32) 7.54 (3.48, 16.32) 1.50 1.50 Buning C (2005) 5.48 (2.57, 11.67) 5.48 (2.57, 11.67) 1.55 1.55 Braat H (2005) 2.34 (1.10, 4.98) 2.34 (1.10, 4.98) 1.55 1.55 Zhou Z (2002) 1.73 (0.82, 3.68) 1.73 (0.82, 3.68) 1.55 1.55 Tomer G (2003) 5.46 (2.59, 11.49) 5.46 (2.59, 11.49) 1.58 1.58 Helio T (2003) 2.97 (1.42, 6.22) 2.97 (1.42, 6.22) 1.59 1.59 Mendoza JL (2003) 3.66 (1.78, 7.55) 3.66 (1.78, 7.55) 1.63 1.63 Ferreira AC (2005) 4.49 (2.18, 9.22) 4.49 (2.18, 9.22) 1.64 1.64 Cucchiara S (2007) 4.54 (2.23, 9.26) 4.54 (2.23, 9.26) 1.66 1.66 Economou M (2007) 7.06 (3.47, 14.37) 7.06 (3.47, 14.37) 1.67 1.67 Tukel T (2004) 4.18 (2.09, 8.37) 4.18 (2.09, 8.37) 1.72 1.72 Gazouli M (2004) 3.42 (1.75, 6.69) 3.42 (1.75, 6.69) 1.79 1.79 Ahmad T (2002) 6.50 (3.33, 12.68) 6.50 (3.33, 12.68) 1.79 1.79 Esters N (2004) 3.01 (1.55, 5.84) 3.01 (1.55, 5.84) 1.81 1.81 Lakatos PL (2005) 4.78 (2.48, 9.21) 4.78 (2.48, 9.21) 1.83 1.83 Sugimura K (2003) 3.56 (1.87, 6.77) 3.56 (1.87, 6.77) 1.87 1.87 Cuthbert AP (2002) 3.23 (1.72, 6.10) 3.23 (1.72, 6.10) 1.90 1.90 Newman B (2004) 1.76 (0.95, 3.26) 1.76 (0.95, 3.26) 1.97 1.97 Riss L (2007) 2.13 (1.15, 3.92) 2.13 (1.15, 3.92) 1.98 1.98 Brant SR (2007) 2.96 (1.66, 5.30) 2.96 (1.66, 5.30) 2.09 2.09 Ernst A (2007) 5.70 (3.34, 9.74) 5.70 (3.34, 9.74) 2.26 2.26 Oostenbrug LE (2006) 2.87 (1.71, 4.83) 2.87 (1.71, 4.83) 2.32 2.32 de Ridder L (2007) 1.70 (1.02, 2.82) 1.70 (1.02, 2.82) 2.38 2.38 Kugathasan S (2005) 6.82 (4.12, 11.29) 6.82 (4.12, 11.29) 2.39 2.39 Ogura Y (2001) 2.13 (1.31, 3.46) 2.13 (1.31, 3.46) 2.46 2.46 Mascheretti S (2002) 2.82 (1.75, 4.55) 2.82 (1.75, 4.55) 2.49 2.49 Bonen DK (2003) 2.45 (1.53, 3.92) 2.45 (1.53, 3.92) 2.53 2.53 Hampe J (2001) 4.11 (2.59, 6.54) 4.11 (2.59, 6.54) 2.56 2.56 Hampe J (2002) 4.73 (3.26, 6.86) 4.73 (3.26, 6.86) 2.98 2.98 Hradsky O (2008) 4.76 (3.39, 6.69) 4.76 (3.39, 6.69) 3.12 3.12 Weersma RK (2009) 3.69 (2.73, 4.98) 3.69 (2.73, 4.98) 3.31 3.31 Random effect Fixed effect 3.84 (3.41, 4.32) 3.89 (3.58, 4.24) .05 1 1 5 10 50 Odds ratio (95% CI)
Supplementary Figure 5. Detailed meta-analysis of Arg702Trp on the basis of allele frequencies. Ulcerative colitis. All studies. . OR (95% CI) Weight Study Ulcerative colitis Jess T (2005) 0.11 (0.01, 2.05) 0.11 (0.01, 2.05) 0.45 0.45 Cavanaugh JA (2003) 0.13 (0.01, 2.18) 0.13 (0.01, 2.18) 0.49 0.49 Derakhshan F (2008) 0.25 (0.03, 2.22) 0.25 (0.03, 2.22) 0.77 0.77 Zaahl MG (2005) 0.47 (0.06, 3.96) 0.47 (0.06, 3.96) 0.82 0.82 Rigoli L (2008) 0.91 (0.17, 4.80) 0.91 (0.17, 4.80) 1.28 1.28 Gazouli M (2004) 7.52 (1.66, 34.09) 7.52 (1.66, 34.09) 1.50 1.50 Protic MB (2007) 0.09 (0.02, 0.39) 0.09 (0.02, 0.39) 1.59 1.59 Karban A (2004) 2.21 (0.55, 8.97) 2.21 (0.55, 8.97) 1.70 1.70 Ozen SC (2006) 0.88 (0.22, 3.57) 0.88 (0.22, 3.57) 1.70 1.70 Ince AT (2008) 0.51 (0.13, 1.95) 0.51 (0.13, 1.95) 1.81 1.81 Crawford NPS (2007) 2.29 (0.63, 8.31) 2.29 (0.63, 8.31) 1.94 1.94 Helio T (2003) 0.82 (0.23, 2.98) 0.82 (0.23, 2.98) 1.95 1.95 van der Linde K (2007) 0.78 (0.23, 2.60) 0.78 (0.23, 2.60) 2.14 2.14 Economou M (2007) 1.26 (0.38, 4.13) 1.26 (0.38, 4.13) 2.19 2.19 Russel RK (2005) 0.77 (0.27, 2.22) 0.77 (0.27, 2.22) 2.62 2.62 Ferraris A (2006) 2.06 (0.74, 5.78) 2.06 (0.74, 5.78) 2.71 2.71 Bianchi V (2007) 0.70 (0.27, 1.85) 0.70 (0.27, 1.85) 2.97 2.97 Hugot JP (2001) 0.80 (0.31, 2.07) 0.80 (0.31, 2.07) 3.04 3.04 Buning C (2005) 1.19 (0.47, 2.99) 1.19 (0.47, 2.99) 3.14 3.14 de Ridder L (2007) 3.52 (1.42, 8.74) 3.52 (1.42, 8.74) 3.21 3.21 Braat H (2005) 2.01 (0.97, 4.16) 2.01 (0.97, 4.16) 4.19 4.19 Brant SR (2007) 1.54 (0.75, 3.16) 1.54 (0.75, 3.16) 4.24 4.24 Arnot IDR (2004) 0.46 (0.23, 0.95) 0.46 (0.23, 0.95) 4.29 4.29 Giachino D (2004) 1.93 (1.02, 3.67) 1.93 (1.02, 3.67) 4.77 4.77 Gearry RB (2007) 1.51 (0.80, 2.84) 1.51 (0.80, 2.84) 4.82 4.82 Oostenbrug LE (2006) 0.75 (0.40, 1.41) 0.75 (0.40, 1.41) 4.86 4.86 Cucchiara S (2007) 1.18 (0.64, 2.20) 1.18 (0.64, 2.20) 4.91 4.91 Esters N (2004) 1.39 (0.75, 2.54) 1.39 (0.75, 2.54) 5.01 5.01 Annese V (2005) 0.97 (0.54, 1.77) 0.97 (0.54, 1.77) 5.08 5.08 Cuthbert AP (2002) 1.04 (0.60, 1.79) 1.04 (0.60, 1.79) 5.50 5.50 Ernst A (2007) 1.16 (0.75, 1.81) 1.16 (0.75, 1.81) 6.36 6.36 Weersma RK (2009) 1.00 (0.77, 1.29) 1.00 (0.77, 1.29) 7.95 7.95 Random effect Fixed effect 1.10 (0.90, 1.34) 1.06 (0.93, 1.20) .05 1 1 5 10 50 Odds ratio (95% CI)
Supplementary Figure 6. Detailed meta-analysis of Gly908Arg on the basis of allele frequencies. Ulcerative colitis. All studies. Study OR (95% CI) Weight, % Ulcerative colitis Zaahl MG (2005) 0.94 (0.04, 23.42) 0.94 (0.04, 23.42) 0.52 0.52 van der Linde K (2007) 0.58 (0.02, 14.49) 0.58 (0.02, 14.49) 0.52 0.52 Jess T (2005) 0.20 (0.01, 4.22) 0.20 (0.01, 4.22) 0.57 0.57 Hugot JP (2001) 0.13 (0.01, 2.69) 0.13 (0.01, 2.69) 0.57 0.57 Cavanaugh JA (2003) 0.68 (0.04, 11.84) 0.68 (0.04, 11.84) 0.65 0.65 de Ridder L (2007) 0.19 (0.01, 3.10) 0.19 (0.01, 3.10) 0.67 0.67 Ince AT (2008) 0.69 (0.06, 7.67) 0.69 (0.06, 7.67) 0.90 0.90 Ferraris A (2006) 0.44 (0.05, 3.95) 0.44 (0.05, 3.95) 1.07 1.07 Arnot IDR (2004) 7.50 (0.96, 58.85) 7.50 (0.96, 58.85) 1.22 1.22 Ozen SC (2006) 0.88 (0.12, 6.32) 0.88 (0.12, 6.32) 1.33 1.33 Derakhshan F (2008) 1.51 (0.25, 9.12) 1.51 (0.25, 9.12) 1.57 1.57 Bianchi V (2007) 1.80 (0.36, 8.99) 1.80 (0.36, 8.99) 1.92 1.92 Karban A (2004) 0.62 (0.13, 3.01) 0.62 (0.13, 3.01) 1.98 1.98 Crawford NPS (2007) 1.22 (0.30, 4.96) 1.22 (0.30, 4.96) 2.48 2.48 Buning C (2005) 1.30 (0.35, 4.90) 1.30 (0.35, 4.90) 2.74 2.74 Giachino D (2004) 1.95 (0.56, 6.82) 1.95 (0.56, 6.82) 3.02 3.02 Cuthbert AP (2002) 3.08 (0.90, 10.49) 3.08 (0.90, 10.49) 3.13 3.13 Rigoli L (2008) 1.02 (0.31, 3.40) 1.02 (0.31, 3.40) 3.23 3.23 Brant SR (2007) 2.00 (0.63, 6.38) 2.00 (0.63, 6.38) 3.46 3.46 Gearry RB (2007) 0.94 (0.34, 2.59) 0.94 (0.34, 2.59) 4.27 4.27 Esters N (2004) 1.77 (0.65, 4.85) 1.77 (0.65, 4.85) 4.36 4.36 Gazouli M (2004) 4.31 (1.80, 10.33) 4.31 (1.80, 10.33) 5.45 5.45 Braat H (2005) 0.41 (0.17, 0.97) 0.41 (0.17, 0.97) 5.54 5.54 Ernst A (2007) 0.79 (0.35, 1.80) 0.79 (0.35, 1.80) 5.98 5.98 Annese V (2005) 0.73 (0.33, 1.58) 0.73 (0.33, 1.58) 6.47 6.47 Oostenbrug LE (2006) 0.91 (0.44, 1.86) 0.91 (0.44, 1.86) 7.24 7.24 Cucchiara S (2007) 1.47 (0.72, 2.99) 1.47 (0.72, 2.99) 7.34 7.34 Economou M (2007) 0.82 (0.43, 1.59) 0.82 (0.43, 1.59) 8.12 8.12 Weersma RK (2009) 1.00 (0.67, 1.50) 1.00 (0.67, 1.50) 13.69 13.69 Helio T (2003) (Excluded) (Excluded) 0.00 0.00 Russel RK (2005) (Excluded) (Excluded) 0.00 0.00 Protic MB (2007) (Excluded) (Excluded) 0.00 0.00 Random effect Fixed effect 1.10 (0.87, 1.39) 1.10 (0.91, 1.33) .05 1 1 5 10 50 Odds ratio (95% CI) Studies were excluded from meta-analysis if the risk allele/genotype was found neither in cases nor in controls.
Supplementary Figure 7. Detailed meta-analysis of Leu1007fsincC on the basis of allele frequencies. Ulcerative colitis. All studies. Study Ulcerative colitits OR (95% CI) Weight, % Ince AT (2008) 0.46 (0.02, 11.31) 0.46 (0.02, 11.31) 0.35 0.35 Roussomoustakaki M (2003) 0.28 (0.01, 5.91) 0.28 (0.01, 5.91) 0.39 0.39 Derakhshan F (2008) 0.20 (0.01, 4.15) 0.20 (0.01, 4.15) 0.39 0.39 Russel RK (2005) 0.29 (0.01, 5.59) 0.29 (0.01, 5.59) 0.41 0.41 Cavanaugh JA (2003) 0.68 (0.04, 11.84) 0.68 (0.04, 11.84) 0.44 0.44 Protic MB (2007) 30.76 (1.79, 529.89) 30.76 (1.79, 529.89) 0.44 0.44 Guo QS (2004) 4.70 (0.42, 52.22) 4.70 (0.42, 52.22) 0.62 0.62 Jess T (2005) 0.25 (0.03, 2.25) 0.25 (0.03, 2.25) 0.73 0.73 Karban A (2004) 0.36 (0.04, 3.01) 0.36 (0.04, 3.01) 0.79 0.79 Giachino D (2004) 0.24 (0.03, 1.90) 0.24 (0.03, 1.90) 0.82 0.82 van der Linde K (2007) 1.18 (0.19, 7.22) 1.18 (0.19, 7.22) 1.09 1.09 Rigoli L (2008) 0.76 (0.15, 3.83) 0.76 (0.15, 3.83) 1.35 1.35 Bianchi V (2007) 2.41 (0.53, 10.88) 2.41 (0.53, 10.88) 1.56 1.56 Hugot JP (2001) 0.48 (0.11, 2.17) 0.48 (0.11, 2.17) 1.56 1.56 de Ridder L (2007) 0.79 (0.18, 3.45) 0.79 (0.18, 3.45) 1.63 1.63 Radlmayr M (2002) 1.24 (0.31, 5.03) 1.24 (0.31, 5.03) 1.80 1.80 Zaahl MG (2005) 1.07 (0.28, 4.17) 1.07 (0.28, 4.17) 1.92 1.92 Ferraris A (2006) 2.24 (0.59, 8.44) 2.24 (0.59, 8.44) 2.00 2.00 Annese V (2005) 3.76 (1.12, 12.63) 3.76 (1.12, 12.63) 2.39 2.39 Crawford NPS (2007) 0.98 (0.31, 3.03) 0.98 (0.31, 3.03) 2.72 2.72 Arnot IDR (2004) 2.82 (0.93, 8.56) 2.82 (0.93, 8.56) 2.82 2.82 Gearry RB (2007) 1.41 (0.48, 4.20) 1.41 (0.48, 4.20) 2.94 2.94 Esters N (2004) 0.47 (0.16, 1.39) 0.47 (0.16, 1.39) 2.96 2.96 Hampe J (2001) 0.69 (0.23, 2.02) 0.69 (0.23, 2.02) 3.01 3.01 Buning C (2005) 1.09 (0.38, 3.09) 1.09 (0.38, 3.09) 3.18 3.18 Helio T (2003) 1.84 (0.66, 5.14) 1.84 (0.66, 5.14) 3.30 3.30 Gazouli M (2004) 0.57 (0.21, 1.56) 0.57 (0.21, 1.56) 3.45 3.45 Braat H (2005) 1.06 (0.44, 2.57) 1.06 (0.44, 2.57) 4.41 4.41 Cucchiara S (2007) 1.72 (0.72, 4.08) 1.72 (0.72, 4.08) 4.57 4.57 Brant SR (2007) 1.24 (0.53, 2.89) 1.24 (0.53, 2.89) 4.77 4.77 Oostenbrug LE (2006) 0.66 (0.29, 1.48) 0.66 (0.29, 1.48) 5.17 5.17 Economou M (2007) 1.06 (0.48, 2.32) 1.06 (0.48, 2.32) 5.48 5.48 Cuthbert AP (2002) 0.71 (0.34, 1.51) 0.71 (0.34, 1.51) 6.05 6.05 Ernst A (2007) 0.89 (0.43, 1.84) 0.89 (0.43, 1.84) 6.35 6.35 Weersma RK (2009) 1.00 (0.67, 1.50) 1.00 (0.67, 1.50) 18.18 18.18 Ozen SC (2006) (Excluded) (Excluded) 0.00 0.00 Random effect Fixed effect 1.02 (0.85, 1.24) 1.02 (0.85, 1.24) 1.05 (0.88, 1.25) .05 1 1 5 10 50 Odds ratio (95% CI) Studies were excluded from meta-analysis if the risk allele/genotype was found neither in cases nor in controls.
Supplementary Figure 8. Detailed meta-analysis of Arg702Trp on the basis of allele frequencies. Crohn’s disease. Northern Europeans. Study Crohn’s disease OR (95% CI) OR (95% CI) Weight Weight, % Vind I (2005) 0.23 (0.01, 4.59) 0.23 (0.01, 4.59) 0.22 0.22 Torkvist L (2006) 6.68 (1.52, 29.31) 6.68 (1.52, 29.31) 0.87 0.87 Jess T (2005) 3.76 (1.11, 12.80) 3.76 (1.11, 12.80) 1.25 1.25 Buhner S (2006) 3.15 (1.06, 9.32) 3.15 (1.06, 9.32) 1.57 1.57 Lappalainen M (2008) 2.15 (0.83, 5.55) 2.15 (0.83, 5.55) 2.01 2.01 van der Linde K (2007) 1.53 (0.68, 3.45) 1.53 (0.68, 3.45) 2.64 2.64 Helio T (2003) 1.84 (0.86, 3.93) 1.84 (0.86, 3.93) 3.00 3.00 Russel RK (2005) 1.19 (0.58, 2.43) 1.19 (0.58, 2.43) 3.35 3.35 Braat H (2005) 2.89 (1.47, 5.65) 2.89 (1.47, 5.65) 3.70 3.70 Riss L (2007) 1.93 (1.11, 3.36) 1.93 (1.11, 3.36) 5.08 5.08 Arnot IDR (2004) 1.48 (0.88, 2.51) 1.48 (0.88, 2.51) 5.53 5.53 Vermeire S (2004) 2.94 (1.74, 4.96) 2.94 (1.74, 4.96) 5.57 5.57 de Ridder L (2007) 2.96 (1.77, 4.93) 2.96 (1.77, 4.93) 5.75 5.75 Cuthbert AP (2002) 2.72 (1.64, 4.50) 2.72 (1.64, 4.50) 5.87 5.87 Esters N (2004) 2.42 (1.48, 3.97) 2.42 (1.48, 3.97) 6.05 6.05 Oostenbrug LE (2006) 1.88 (1.21, 2.92) 1.88 (1.21, 2.92) 7.22 7.22 Ahmad T (2002) 2.63 (1.71, 4.04) 2.63 (1.71, 4.04) 7.42 7.42 Ernst A (2007) 2.02 (1.32, 3.09) 2.02 (1.32, 3.09) 7.48 7.48 Hampe J (2002) 2.72 (1.92, 3.84) 2.72 (1.92, 3.84) 9.84 9.84 Weersma RK (2009) 1.65 (1.33, 2.04) 1.65 (1.33, 2.04) 15.58 15.58 Random effect Fixed effect 2.17 (1.88, 2.49) 2.17 (1.88, 2.49) 2.12 (1.90, 2.37) .05 1 1 5 10 50 Odds ratio (95% CI)
Supplementary Figure 9. Detailed meta-analysis of Gly908Arg on the asis of allele frequencies. Crohn’s disease. Northern Europeans. Study Crohn’s disease OR (95% CI) OR (95% CI) Weight Weight, % Lappalainen M (2008) 3.98 (0.19, 83.06) 3.98 (0.19, 83.06) 0.86 0.86 Helio T (2003) 7.79 (0.40, 151.18) 7.79 (0.40, 151.18) 0.90 0.90 Russel RK (2005) 11.20 (0.64, 197.01) 11.20 (0.64, 197.01) 0.96 0.96 Torkvist L (2006) 12.30 (0.70, 216.21) 12.30 (0.70, 216.21) 0.96 0.96 van der Linde K (2007) 9.88 (1.29, 75.93) 9.88 (1.29, 75.93) 1.78 1.78 Arnot IDR (2004) 7.10 (0.93, 54.19) 7.10 (0.93, 54.19) 1.79 1.79 Jess T (2005) 2.31 (0.38, 14.24) 2.31 (0.38, 14.24) 2.17 2.17 Vind I (2005) 4.32 (0.83, 22.66) 4.32 (0.83, 22.66) 2.54 2.54 Buhner S (2006) 2.63 (0.57, 12.19) 2.63 (0.57, 12.19) 2.88 2.88 Cuthbert AP (2002) 6.71 (2.03, 22.14) 6.71 (2.03, 22.14) 4.22 4.22 Riss L (2007) 0.99 (0.35, 2.81) 0.99 (0.35, 2.81) 5.10 5.10 Vermeire S (2004) 2.10 (0.81, 5.42) 2.10 (0.81, 5.42) 5.72 5.72 Esters N (2004) 3.43 (1.47, 7.97) 3.43 (1.47, 7.97) 6.57 6.57 Ahmad T (2002) 2.33 (1.05, 5.18) 2.33 (1.05, 5.18) 6.98 6.98 Ernst A (2007) 1.55 (0.73, 3.29) 1.55 (0.73, 3.29) 7.41 7.41 Hampe J (2002) 5.72 (2.91, 11.25) 5.72 (2.91, 11.25) 8.21 8.21 Braat H (2005) 1.11 (0.59, 2.09) 1.11 (0.59, 2.09) 8.65 8.65 Oostenbrug LE (2006) 1.42 (0.83, 2.45) 1.42 (0.83, 2.45) 9.75 9.75 de Ridder L (2007) 1.31 (0.78, 2.22) 1.31 (0.78, 2.22) 9.99 9.99 Weersma RK (2009) 2.05 (1.49, 2.82) 2.05 (1.49, 2.82) 12.56 12.56 Random effectt Fixed effect 2.30 (1.72, 3.08) 2.30 (1.72, 3.08) 2.25 (1.89, 2.68) .05 1 1 5 10 50 Odds ratio (95% CI)
Supplementary Figure 10. Detailed meta-analysis of Leu1007fsincC on the basis of allele frequencies. Crohn’s disease. Northern Europeans. Study Crohn’s disease OR (95% CI) OR (95% CI) Weight, % Weight Buhner S (2006) 18.74 (2.53, 138.87) 18.74 (2.53, 138.87) 0.94 0.94 Jess T (2005) 1.13 (0.24, 5.23) 1.13 (0.24, 5.23) 1.52 1.52 Russel RK (2005) 3.51 (1.00, 12.37) 3.51 (1.00, 12.37) 2.12 2.12 Murillo L (2002) 9.27 (2.74, 31.36) 9.27 (2.74, 31.36) 2.23 2.23 van der Linde K (2007) 6.12 (1.81, 20.64) 6.12 (1.81, 20.64) 2.24 2.24 Vind I (2005) 4.98 (1.55, 16.02) 4.98 (1.55, 16.02) 2.38 2.38 Torkvist L (2006) 1.13 (0.35, 3.59) 1.13 (0.35, 3.59) 2.42 2.42 Radlmayr M (2002) 9.54 (3.28, 27.77) 9.54 (3.28, 27.77) 2.74 2.74 Arnot IDR (2004) 3.86 (1.35, 11.03) 3.86 (1.35, 11.03) 2.81 2.81 Lappalainen M (2008) 3.14 (1.26, 7.78) 3.14 (1.26, 7.78) 3.47 3.47 Riss L (2007) 1.75 (0.78, 3.94) 1.75 (0.78, 3.94) 4.04 4.04 Vermeire S (2004) 6.41 (2.87, 14.31) 6.41 (2.87, 14.31) 4.09 4.09 Braat H (2005) 2.34 (1.10, 4.98) 2.34 (1.10, 4.98) 4.43 4.43 Helio T (2003) 2.97 (1.42, 6.22) 2.97 (1.42, 6.22) 4.55 4.55 Ahmad T (2002) 6.50 (3.33, 12.68) 6.50 (3.33, 12.68) 5.11 5.11 Esters N (2004) 3.01 (1.55, 5.84) 3.01 (1.55, 5.84) 5.16 5.16 Cuthbert AP (2002) 3.23 (1.72, 6.10) 3.23 (1.72, 6.10) 5.41 5.41 Ernst A (2007) 5.70 (3.34, 9.74) 5.70 (3.34, 9.74) 6.38 6.38 Oostenbrug LE (2006) 2.87 (1.71, 4.83) 2.87 (1.71, 4.83) 6.56 6.56 de Ridder L (2007) 1.70 (1.02, 2.82) 1.70 (1.02, 2.82) 6.71 6.71 Hampe J (2001) 4.11 (2.59, 6.54) 4.11 (2.59, 6.54) 7.19 7.19 Hampe J (2002) 4.73 (3.26, 6.86) 4.73 (3.26, 6.86) 8.31 8.31 Weersma RK (2009) 3.69 (2.73, 4.98) 3.69 (2.73, 4.98) 9.20 9.20 Random effect Fixed effect 3.65 (2.98, 4.47) 3.65 (2.98, 4.47) 3.78 (3.30, 4.32) .05 1 1 5 10 50 Odds ratio (95% CI)
Supplementary Figure 11. Detailed meta-analysis of Arg702Trp on the basis of allele frequencies. Crohn’s disease. Southern Europeans. Crohn’s disease OR (95% CI) OR (95% CI) Weight,% Study Vavassori P (2004) 1.52 (0.28, 8.37) 1.52 (0.28, 8.37) 0.92 0.92 Canto E (2007) 6.59 (1.52, 28.55) 6.59 (1.52, 28.55) 1.20 1.20 Gazouli M (2004) 11.00 (2.57, 47.14) 11.00 (2.57, 47.14) 1.22 1.22 Bene J (2006) 1.89 (0.58, 6.10) 1.89 (0.58, 6.10) 1.77 1.77 Economou M (2007) 3.85 (1.25, 11.93) 3.85 (1.25, 11.93) 1.89 1.89 Karban A (2004) 4.13 (1.38, 12.34) 4.13 (1.38, 12.34) 1.99 1.99 Karban A (2005) 4.24 (1.46, 12.30) 4.24 (1.46, 12.30) 2.08 2.08 Rigoli L (2008) 4.36 (1.64, 11.55) 4.36 (1.64, 11.55) 2.39 2.39 Vind I (2005) 2.04 (0.77, 5.37) 2.04 (0.77, 5.37) 2.41 2.41 Ferraris A (2006) 4.51 (1.91, 10.64) 4.51 (1.91, 10.64) 2.90 2.90 Nagy Z (2005) 2.30 (1.00, 5.27) 2.30 (1.00, 5.27) 3.04 3.04 Cottone M (2006) 2.98 (1.33, 6.70) 2.98 (1.33, 6.70) 3.15 3.15 Rodrigo L (2007) 0.79 (0.36, 1.72) 0.79 (0.36, 1.72) 3.31 3.31 Magyari L (2009) 1.41 (0.66, 3.03) 1.41 (0.66, 3.03) 3.42 3.42 Buning C (2005) 2.81 (1.33, 5.92) 2.81 (1.33, 5.92) 3.53 3.53 Heresbach D (2004) 2.60 (1.25, 5.43) 2.60 (1.25, 5.43) 3.60 3.60 Mendoza JL (2003) 3.52 (1.70, 7.26) 3.52 (1.70, 7.26) 3.66 3.66 Cukovic-Cavak S (2006) 2.79 (1.35, 5.76) 2.79 (1.35, 5.76) 3.67 3.67 Diego CD (2006) 2.29 (1.15, 4.58) 2.29 (1.15, 4.58) 3.88 3.88 Riss L (2007) 2.99 (1.50, 5.97) 2.99 (1.50, 5.97) 3.90 3.90 Bianchi V (2007) 1.79 (0.94, 3.42) 1.79 (0.94, 3.42) 4.24 4.24 Nunez C (2004) 1.17 (0.62, 2.20) 1.17 (0.62, 2.20) 4.34 4.34 Lakatos PL (2005) 2.55 (1.37, 4.73) 2.55 (1.37, 4.73) 4.46 4.46 Giachino D (2004) 1.56 (0.89, 2.76) 1.56 (0.89, 2.76) 4.92 4.92 Annese V (2005) 2.20 (1.26, 3.85) 2.20 (1.26, 3.85) 5.00 5.00 Protic MB (2007) 1.50 (0.90, 2.50) 1.50 (0.90, 2.50) 5.47 5.47 Cucchiara S (2007) 3.01 (1.83, 4.95) 3.01 (1.83, 4.95) 5.62 5.62 Ferreira AC (2005) 3.31 (2.03, 5.38) 3.31 (2.03, 5.38) 5.75 5.75 Hradsky O (2008) 1.48 (0.95, 2.30) 1.48 (0.95, 2.30) 6.29 6.29 Random effect Fixed effect 2.34 (1.98, 2.78) 2.34 (1.98, 2.78) 2.36 (2.07, 2.68) .05 1 1 5 10 50 Odds ratio (95% CI)
Supplementary Figure 12. Detailed meta-analysis of Gly908Arg on the basis of allele frequencies. Crohn’s disease. Southern Europeans. Crohn’s disease Study OR (95% CI) OR (95% CI) Weight Weight,% Canto E (2007) 5.83 (0.32, 106.57) 5.83 (0.32, 106.57) 0.58 0.58 Protic MB (2007) 20.60 (1.22, 347.57) 20.60 (1.22, 347.57) 0.61 0.61 Bene J (2006) 6.28 (0.78, 50.38) 6.28 (0.78, 50.38) 1.08 1.08 Vind I (2005) 3.69 (0.72, 18.80) 3.69 (0.72, 18.80) 1.69 1.69 Rodrigo L (2007) 1.20 (0.24, 5.99) 1.20 (0.24, 5.99) 1.72 1.72 Nagy Z (2005) 1.95 (0.43, 8.86) 1.95 (0.43, 8.86) 1.92 1.92 Cukovic-Cavak S (2006) 4.15 (0.92, 18.78) 4.15 (0.92, 18.78) 1.93 1.93 Magyari L (2009) 8.20 (1.83, 36.73) 8.20 (1.83, 36.73) 1.95 1.95 Riss L (2007) 1.68 (0.43, 6.58) 1.68 (0.43, 6.58) 2.28 2.28 Heresbach D (2004) 2.37 (0.68, 8.28) 2.37 (0.68, 8.28) 2.63 2.63 Nunez C (2004) 5.19 (1.49, 18.10) 5.19 (1.49, 18.10) 2.64 2.64 Bianchi V (2007) 4.79 (1.37, 16.71) 4.79 (1.37, 16.71) 2.64 2.64 Diego CD (2006) 2.63 (0.83, 8.35) 2.63 (0.83, 8.35) 2.99 2.99 Buning C (2005) 2.58 (0.85, 7.77) 2.58 (0.85, 7.77) 3.21 3.21 Ferraris A (2006) 6.89 (2.33, 20.32) 6.89 (2.33, 20.32) 3.30 3.30 Mendoza JL (2003) 4.64 (1.62, 13.25) 4.64 (1.62, 13.25) 3.46 3.46 Giachino D (2004) 3.17 (1.15, 8.76) 3.17 (1.15, 8.76) 3.63 3.63 Vavassori P (2004) 2.66 (0.97, 7.31) 2.66 (0.97, 7.31) 3.65 3.65 Cottone M (2006) 4.01 (1.61, 9.99) 4.01 (1.61, 9.99) 4.22 4.22 Ferreira AC (2005) 2.19 (0.90, 5.33) 2.19 (0.90, 5.33) 4.38 4.38 Rigoli L (2008) 1.03 (0.43, 2.50) 1.03 (0.43, 2.50) 4.42 4.42 Gazouli M (2004) 4.55 (1.97, 10.51) 4.55 (1.97, 10.51) 4.75 4.75 Lakatos PL (2005) 1.76 (0.77, 4.02) 1.76 (0.77, 4.02) 4.83 4.83 Karban A (2004) 7.00 (3.12, 15.69) 7.00 (3.12, 15.69) 4.97 4.97 Karban A (2005) 5.76 (2.59, 12.81) 5.76 (2.59, 12.81) 5.04 5.04 Economou M (2007) 0.84 (0.39, 1.79) 0.84 (0.39, 1.79) 5.36 5.36 Annese V (2005) 2.85 (1.46, 5.56) 2.85 (1.46, 5.56) 6.20 6.20 Cucchiara S (2007) 2.97 (1.63, 5.42) 2.97 (1.63, 5.42) 6.93 6.93 Hradsky O (2008) 2.82 (1.55, 5.12) 2.82 (1.55, 5.12) 6.99 6.99 Random effect Fixed effect 3.03 (2.42, 3.80) 3.03 (2.42, 3.80) 3.20 (2.67, 3.83) .05 1 1 5 10 50 Odds ratio (95% CI)
Supplementary Figure 13. Detailed meta-analysis of Leu1007fsincC on the basis of allele frequencies. Crohn’s disease. Southern Europeans. OR (95% CI) OR (95% CI) Weight Weight, % Crohn’s disease Study Vind I (2005) 0.26 (0.01, 4.75) 0.26 (0.01, 4.75) 0.28 0.28 Protic MB (2007) 64.25 (3.92, 1052.26) 64.25 (3.92, 1052.26) 0.30 0.30 Canto E (2007) 4.26 (0.53, 34.53) 4.26 (0.53, 34.53) 0.53 0.53 Roussomoustakaki M (2003) 1.82 (0.30, 11.07) 1.82 (0.30, 11.07) 0.72 0.72 Rodrigo L (2007) 1.75 (0.49, 6.21) 1.75 (0.49, 6.21) 1.45 1.45 Nunez C (2004) 5.19 (1.49, 18.10) 5.19 (1.49, 18.10) 1.50 1.50 Bene J (2006) 5.24 (1.52, 18.07) 5.24 (1.52, 18.07) 1.52 1.52 Bianchi V (2007) 5.80 (1.69, 19.89) 5.80 (1.69, 19.89) 1.54 1.54 Vavassori P (2004) 10.40 (3.17, 34.13) 10.40 (3.17, 34.13) 1.65 1.65 Annese V (2005) 13.97 (4.35, 44.87) 13.97 (4.35, 44.87) 1.72 1.72 Ferraris A (2006) 6.18 (2.08, 18.40) 6.18 (2.08, 18.40) 1.97 1.97 Nagy Z (2005) 4.03 (1.40, 11.55) 4.03 (1.40, 11.55) 2.11 2.11 Riss L (2007) 2.94 (1.16, 7.45) 2.94 (1.16, 7.45) 2.70 2.70 Karban A (2004) 3.22 (1.28, 8.08) 3.22 (1.28, 8.08) 2.76 2.76 Rigoli L (2008) 3.61 (1.46, 8.95) 3.61 (1.46, 8.95) 2.84 2.84 Karban A (2005) 3.17 (1.30, 7.73) 3.17 (1.30, 7.73) 2.93 2.93 Diego CD (2006) 2.35 (0.96, 5.73) 2.35 (0.96, 5.73) 2.93 2.93 Cottone M (2006) 4.26 (1.82, 9.98) 4.26 (1.82, 9.98) 3.23 3.23 Magyari L (2009) 5.10 (2.18, 11.94) 5.10 (2.18, 11.94) 3.23 3.23 Giachino D (2004) 2.88 (1.27, 6.53) 2.88 (1.27, 6.53) 3.49 3.49 Cukovic-Cavak S (2006) 2.90 (1.30, 6.45) 2.90 (1.30, 6.45) 3.66 3.66 Heresbach D (2004) 2.26 (1.03, 4.95) 2.26 (1.03, 4.95) 3.80 3.80 Buning C (2005) 5.48 (2.57, 11.67) 5.48 (2.57, 11.67) 4.10 4.10 Mendoza JL (2003) 3.66 (1.78, 7.55) 3.66 (1.78, 7.55) 4.47 4.47 Ferreira AC (2005) 4.49 (2.18, 9.22) 4.49 (2.18, 9.22) 4.50 4.50 Cucchiara S (2007) 4.54 (2.23, 9.26) 4.54 (2.23, 9.26) 4.61 4.61 Economou M (2007) 7.06 (3.47, 14.37) 7.06 (3.47, 14.37) 4.62 4.62 Gazouli M (2004) 3.42 (1.75, 6.69) 3.42 (1.75, 6.69) 5.20 5.20 Lakatos PL (2005) 4.78 (2.48, 9.21) 4.78 (2.48, 9.21) 5.42 5.42 Hradsky O (2008) 4.76 (3.39, 6.69) 4.76 (3.39, 6.69) 20.22 20.22 Random effect Fixed effect 4.21 (3.61, 4.91) 4.21 (3.61, 4.91) 4.45 (3.82, 5.18) .05 1 1 5 10 50 Odds ratio (95% CI)
Supplementary Figure 14. Detailed meta-analysis of Arg702Trp on the basis of allele frequencies. Crohn’s disease. Adults. Study Crohn’s disease OR (95% CI) OR (95% CI) Weight Weight, % Torkvist L (2006) 6.68 (1.52, 29.31) 6.68 (1.52, 29.31) 1.49 1.49 Bene J (2006) 2.35 (0.71, 7.75) 2.35 (0.71, 7.75) 2.28 2.28 Karban A (2004) 4.13 (1.38, 12.34) 4.13 (1.38, 12.34) 2.71 2.71 Magyari L (2009) 1.50 (0.63, 3.55) 1.50 (0.63, 3.55) 4.37 4.37 Nagy Z (2005) 2.30 (1.00, 5.27) 2.30 (1.00, 5.27) 4.72 4.72 Buning C (2005) 2.81 (1.33, 5.92) 2.81 (1.33, 5.92) 5.84 5.84 Diego CD (2006) 2.29 (1.15, 4.58) 2.29 (1.15, 4.58) 6.76 6.76 Lakatos PL (2005) 2.55 (1.37, 4.73) 2.55 (1.37, 4.73) 8.46 8.46 Annese V (2005) 2.20 (1.26, 3.85) 2.20 (1.26, 3.85) 10.40 10.40 Arnot IDR (2004) 1.48 (0.88, 2.51) 1.48 (0.88, 2.51) 11.80 11.80 de Ridder L (2008) 2.86 (1.69, 4.82) 2.86 (1.69, 4.82) 11.82 11.82 Brant SR (2007) 3.49 (2.08, 5.86) 3.49 (2.08, 5.86) 12.10 12.10 Riss L (2007) 2.31 (1.50, 3.57) 2.31 (1.50, 3.57) 17.27 17.27 Random effect Fixed effect 2.43 (2.03, 2.91) 2.43 (2.03, 2.91) 2.46 (2.06, 2.95) .05 1 1 5 10 50 Odds ratio (95% CI)
Supplementary Figure 15. Detailed meta-analysis of Gly908Arg on the basis of allele frequencies. Crohn’s disease. Adults. Crohn’s disease OR (95% CI) OR (95% CI) Weight, % Weight Study Torkvist L (2006) 12.30 (0.70, 216.21) 12.30 (0.70, 216.21) 1.55 1.55 Bene J (2006) 1.80 (0.16, 20.12) 1.80 (0.16, 20.12) 2.13 2.13 Magyari L (2009) 5.78 (0.69, 48.50) 5.78 (0.69, 48.50) 2.68 2.68 Arnot IDR (2004) 7.10 (0.93, 54.19) 7.10 (0.93, 54.19) 2.90 2.90 Nagy Z (2005) 1.95 (0.43, 8.86) 1.95 (0.43, 8.86) 4.76 4.76 Diego CD (2006) 2.63 (0.83, 8.35) 2.63 (0.83, 8.35) 7.12 7.12 Buning C (2005) 2.58 (0.85, 7.77) 2.58 (0.85, 7.77) 7.57 7.57 Brant SR (2007) 4.06 (1.69, 9.73) 4.06 (1.69, 9.73) 10.09 10.09 Riss L (2007) 1.21 (0.53, 2.76) 1.21 (0.53, 2.76) 10.73 10.73 Lakatos PL (2005) 1.76 (0.77, 4.02) 1.76 (0.77, 4.02) 10.75 10.75 Karban A (2004) 7.00 (3.12, 15.69) 7.00 (3.12, 15.69) 11.01 11.01 Annese V (2005) 2.85 (1.46, 5.56) 2.85 (1.46, 5.56) 13.16 13.16 de Ridder L (2008) 1.37 (0.80, 2.35) 1.37 (0.80, 2.35) 15.55 15.55 Random effect Fixed effect 2.59 (1.79, 3.75) 2.59 (1.79, 3.75) 2.61 (2.02, 3.37) .05 1 1 5 10 50 Odds ratio (95% CI)
Supplementary Figure 16. Detailed meta-analysis of Leu1007fsincC on the basis of allele frequencies. Crohn’s disease. Adults. Crohn’s disease Study OR (95% CI) OR (95% CI) Weight Weight, % Bene J (2006) 4.24 (1.17, 15.37) 4.24 (1.17, 15.37) 4.60 4.60 Annese V (2005) 13.97 (4.35, 44.87) 13.97 (4.35, 44.87) 5.29 5.29 Torkvist L (2006) 1.13 (0.35, 3.59) 1.13 (0.35, 3.59) 5.34 5.34 Magyari L (2009) 4.83 (1.61, 14.47) 4.83 (1.61, 14.47) 5.75 5.75 Nagy Z (2005) 4.03 (1.40, 11.55) 4.03 (1.40, 11.55) 6.06 6.06 Arnot IDR (2004) 3.86 (1.35, 11.03) 3.86 (1.35, 11.03) 6.08 6.08 Karban A (2004) 3.22 (1.28, 8.08) 3.22 (1.28, 8.08) 7.16 7.16 Diego CD (2006) 2.35 (0.96, 5.73) 2.35 (0.96, 5.73) 7.41 7.41 Buning C (2005) 5.48 (2.57, 11.67) 5.48 (2.57, 11.67) 8.84 8.84 Lakatos PL (2005) 4.78 (2.48, 9.21) 4.78 (2.48, 9.21) 10.03 10.03 Riss L (2007) 2.13 (1.15, 3.92) 2.13 (1.15, 3.92) 10.62 10.62 Brant SR (2007) 2.96 (1.66, 5.30) 2.96 (1.66, 5.30) 11.02 11.02 de Ridder L (2008) 1.61 (0.95, 2.71) 1.61 (0.95, 2.71) 11.81 11.81 Random effect Fixed effect 3.25 (2.36, 4.49) 3.25 (2.36, 4.49) 3.35 (2.70, 4.16) .05 1 1 5 10 50 Odds ratio (95% CI)
Supplementary Figure 17. Detailed meta-analysis of Arg702Trp on the basis of allele frequencies. Crohn’s disease. Children. Study OR (95% CI) OR (95% CI) Weight Weight, % Crohn’s disease Kugathasan S (2005) 0.44 (0.02, 7.89) 0.44 (0.02, 7.89) 3.47 3.47 Bene J (2006) 0.64 (0.07, 5.87) 0.64 (0.07, 5.87) 5.12 5.12 Magyari L (2009) 0.64 (0.07, 5.87) 0.64 (0.07, 5.87) 5.12 5.12 Kugathasan S (2005) 0.53 (0.06, 4.80) 0.53 (0.06, 4.80) 5.19 5.19 Tomer G (2003) 5.47 (1.48, 20.16) 5.47 (1.48, 20.16) 9.47 9.47 Ferraris A (2006) 4.51 (1.91, 10.64) 4.51 (1.91, 10.64) 12.68 12.68 Russel RK (2005) 1.19 (0.58, 2.43) 1.19 (0.58, 2.43) 13.78 13.78 de Ridder L (2007) 7.89 (4.32, 14.43) 7.89 (4.32, 14.43) 14.58 14.58 Kugathasan S (2005) 1.26 (0.76, 2.07) 1.26 (0.76, 2.07) 15.28 15.28 Cucchiara S (2007) 3.01 (1.83, 4.95) 3.01 (1.83, 4.95) 15.29 15.29 Random effect Fixed effect 2.17 (1.19, 3.95) 2.17 (1.19, 3.95) 2.41 (1.89, 3.06) .05 1 1 5 10 50 Odds ratio (95% CI)
Supplementary Figure 18. Detailed meta-analysis of Gly908Arg on the basis of allele frequencies. Crohn’s disease. Children. Weight, % Crohn’s disease OR (95% CI) OR (95% CI) Study Kugathasan S (2005) 0.96 (0.05, 18.98) 0.96 (0.05, 18.98) 3.08 Russel RK (2005) 11.20 (0.64, 197.01) 11.20 (0.64, 197.01) 3.30 Bene J (2006) 21.90 (2.59, 185.04) 21.90 (2.59, 185.04) 5.38 5.38 Magyari L (2009) 21.90 (2.59, 185.04) 21.90 (2.59, 185.04) 5.38 5.38 Ferraris A (2006) 6.89 (2.33, 20.32) 6.89 (2.33, 20.32) 12.80 12.80 de Ridder L (2007) 1.03 (0.41, 2.59) 1.03 (0.41, 2.59) 14.73 14.73 Tomer G (2003) 1.96 (0.98, 3.93) 1.96 (0.98, 3.93) 17.80 17.80 Kugathasan S (2005) 4.27 (2.23, 8.17) 4.27 (2.23, 8.17) 18.43 18.43 Cucchiara S (2007) 2.97 (1.63, 5.42) 2.97 (1.63, 5.42) 19.10 19.10 Kugathasan S (2005) (Excluded) (Excluded) 0.00 0.00 Random effect Fixed effect 3.52 (2.01, 6.16) 3.52 (2.01, 6.16) 3.29 (2.43, 4.43) .05 1 1 5 10 50 Odds ratio (95% CI) Studies were excluded from meta-analysis if the risk allele/genotype was found neither in cases nor in controls.
Supplementary Figure 19. Detailed meta-analysis of Leu1007fsincC on the basis of allele frequencies. Crohn’s disease. Children. OR (95% CI) OR (95% CI) Weight, % Weight Study Crohn’s disease Kugathasan S (2005) 7.06 (0.43, 115.39) 7.06 (0.43, 115.39) 1.03 1.03 Kugathasan S (2005) 2.15 (0.13, 34.64) 2.15 (0.13, 34.64) 1.04 1.04 Bene J (2006) 8.44 (2.11, 33.87) 8.44 (2.11, 33.87) 4.16 4.16 Magyari L (2009) 8.44 (2.11, 33.87) 8.44 (2.11, 33.87) 4.16 4.16 Russel RK (2005) 3.51 (1.00, 12.37) 3.51 (1.00, 12.37) 5.07 5.07 Ferraris A (2006) 6.18 (2.08, 18.40) 6.18 (2.08, 18.40) 6.75 6.75 Tomer G (2003) 5.46 (2.59, 11.49) 5.46 (2.59, 11.49) 14.50 14.50 Cucchiara S (2007) 4.54 (2.23, 9.26) 4.54 (2.23, 9.26) 15.82 15.82 de Ridder L (2007) 2.35 (1.16, 4.80) 2.35 (1.16, 4.80) 15.84 15.84 Kugathasan S (2005) 6.82 (4.12, 11.29) 6.82 (4.12, 11.29) 31.63 31.63 Random effect Fixed effect 5.06 (3.81, 6.71) 5.06 (3.81, 6.71) 5.05 (3.80, 6.69) .05 1 1 5 10 50 Odds ratio (95% CI)
Supplementary Figure 20. Detailed meta-analysis of Arg702Trp on the basis of allele frequencies. Crohn’s disease. Familial cases. Crohn’s disease Study OR (95% CI) Weight, % Tukel T (2004) 6.71 (1.04, 43.16) 6.71 (1.04, 43.16) 1.92 1.92 Helio T (2003) 1.80 (0.49, 6.60) 1.80 (0.49, 6.60) 3.56 3.56 Jess T (2005) 3.76 (1.11, 12.80) 3.76 (1.11, 12.80) 3.91 3.91 Tukel T (2004) 1.80 (0.63, 5.11) 1.80 (0.63, 5.11) 4.98 4.98 Vermeire S (2002) 3.71 (1.49, 9.24) 3.71 (1.49, 9.24) 6.02 6.02 Zhou Z (2002) 1.32 (0.61, 2.88) 1.32 (0.61, 2.88) 7.39 7.39 Hugot JP (2001) 3.06 (1.47, 6.39) 3.06 (1.47, 6.39) 7.90 7.90 Annese V (2005) 2.92 (1.60, 5.32) 2.92 (1.60, 5.32) 9.82 9.82 Vermeire S (2004) 2.94 (1.74, 4.96) 2.94 (1.74, 4.96) 11.09 11.09 Sugimura K (2003) 1.73 (1.10, 2.73) 1.73 (1.10, 2.73) 12.31 12.31 Esters N (2004) 1.19 (0.86, 1.63) 1.19 (0.86, 1.63) 14.94 14.94 Random effect Fixed effect 2. 18 (1.59, 2.97) 1.92 (1.59, 2.31) .05 1 1 5 10 Odds ratio (95% CI)
Supplementary Figure 21. Detailed meta-analysis of Gly908Arg on the basis of allele frequencies. Crohn’s disease. Familial cases. Study Weight, % OR (95% CI) Crohn’s disease Helio T (2003) 19.69 (0.80, 486.97) 0.65 0.65 Vermeire S (2002) 7.75 (0.98, 61.23) 7.75 (0.98, 61.23) 1.53 1.53 Jess T (2005) 2.31 (0.38, 14.24) 2.31 (0.38, 14.24) 1.97 1.97 Hugot JP (2001) 6.49 (1.57, 26.82) 6.49 (1.57, 26.82) 3.17 3.17 Tukel T (2004) 7.52 (1.90, 29.85) 7.52 (1.90, 29.85) 3.35 3.35 Vermeire S (2004) 2.10 (0.81, 5.42) 2.10 (0.81, 5.42) 6.65 6.65 Annese V (2005) 2.75 (1.31, 5.76) 2.75 (1.31, 5.76) 10.27 10.27 Tukel T (2004) 3.19 (1.55, 6.58) 3.19 (1.55, 6.58) 10.67 10.67 Zhou Z (2002) 2.53 (1.30, 4.91) 2.53 (1.30, 4.91) 12.26 12.26 Sugimura K (2003) 1.58 (0.95, 2.63) 1.58 (0.95, 2.63) 18.28 18.28 Esters N (2004) 1.87 (1.12, 3.10) 1.87 (1.12, 3.10) 18.35 18.35 2.47 (1.86, 3.28) Random effect Fixed effect 2.41 (1.88, 3.09) .05 1 1 5 10 50 Odds ratio (95% CI)
Supplementary Figure 22. Detailed meta-analysis of Leu1007fsincC on the basis of allele frequencies. Crohn’s disease. Familial cases. Crohn’s disease Study Weight, % OR (95% CI) Tukel T (2004) 49.85 (2.29, 1082.74) 49.85 (2.29, 1082.74) 1.77 1.77 Vermeire S (2002) 11.95 (1.56, 91.56) 11.95 (1.56, 91.56) 3.35 3.35 Jess T (2005) 1.13 (0.24, 5.23) 1.13 (0.24, 5.23) 4.78 4.78 Annese V (2005) 14.97 (4.53, 49.43) 14.97 (4.53, 49.43) 6.12 6.12 Hugot JP (2001) 6.86 (2.50, 18.83) 6.86 (2.50, 18.83) 6.99 6.99 Helio T (2003) 7.20 (2.91, 17.81) 7.20 (2.91, 17.81) 7.51 7.51 Zhou Z (2002) 2.21 (0.98, 4.97) 2.21 (0.98, 4.97) 8.00 8.00 Vermeire S (2004) 6.41 (2.87, 14.31) 6.41 (2.87, 14.31) 8.04 8.04 Tukel T (2004) 6.06 (2.89, 12.72) 6.06 (2.89, 12.72) 8.36 8.36 Sugimura K (2003) 3.56 (1.87, 6.77) 3.56 (1.87, 6.77) 8.86 8.86 Ogura Y (2001) 2.13 (1.31, 3.46) 2.13 (1.31, 3.46) 9.62 9.62 Esters N (2004) 1.64 (1.10, 2.45) 1.64 (1.10, 2.45) 9.97 9.97 4.17 (2.64, 6.60) Random effect Fixed effect 3.28 (2.65, 4.05) .05 1 1 5 10 Odds ratio (95% CI)
Supplementary Figure 23. Detailed meta-analysis of Arg702Trp on the basis of allele frequencies. Crohn’s disease. Sporadic cases. Crohn’s disease Study OR (95% CI) Weight, % Kugathasan S (2005) 0.44 (0.02, 7.89) 0.44 (0.02, 7.89) 0.99 0.99 Tukel T (2004) 2.55 (0.89, 7.30) 2.55 (0.89, 7.30) 5.79 5.79 Vermeire S (2002) 3.16 (1.29, 7.72) 3.16 (1.29, 7.72) 7.30 7.30 Buhner S (2006) 3.26 (1.37, 7.74) 3.15 (1.06, 9.32) 7.62 7.62 Helio T (2003) 1.82 (0.81, 4.10) 1.82 (0.81, 4.10) 8.28 8.28 Cottone M (2006) 2.98 (1.33, 6.70) 2.98 (1.33, 6.70) 8.33 8.33 Zhou Z (2002) 1.02 (0.49, 2.14) 1.02 (0.49, 2.14) 9.36 9.36 Annese V (2005) 1.54 (0.79, 2.99) 1.54 (0.79, 2.99) 10.50 10.50 Cuthbert AP (2002) 2.72 (1.64, 4.50) 2.72 (1.64, 4.50) 13.58 13.58 Esters N (2004) 1.12 (0.78, 1.61) 1.12 (0.78, 1.61) 16.89 16.89 1.87 (1.35, 2.59) Random effect Fixed effect 1.74 (1.41, 2.14) .05 1 1 5 10 Odds ratio (95% CI)
Supplementary Figure 24. Detailed meta-analysis of Gly908Arg on the basis of allele frequencies. Crohn’s disease. Sporadic cases. Crohn’s disease Study OR (95% CI) Weight, % Helio T (2003) 7.61 (0.36, 158.95) 7.61 (0.36, 158.95) 1.75 1.75 Kugathasan S (2005) 0.96 (0.05, 18.98) 0.96 (0.05, 18.98) 1.81 1.81 Vermeire S (2002) 7.71 (1.00, 59.25) 7.71 (1.00, 59.25) 3.55 3.55 Cuthbert AP (2002) 6.71 (2.03, 22.14) 6.71 (2.03, 22.14) 7.92 7.92 Buhner S (2006) 2.63 (0.57, 12.19) 8.08 8.08 Tukel T (2004) 1.59 (0.58, 4.35) 1.59 (0.58, 4.35) 9.74 9.74 Cottone M (2006) 4.01 (1.61, 9.99) 4.01 (1.61, 9.99) 10.77 10.77 Annese V (2005) 2.94 (1.42, 6.10) 2.94 (1.42, 6.10) 13.24 13.24 Zhou Z (2002) 1.09 (0.56, 2.14) 1.09 (0.56, 2.14) 14.13 14.13 Esters N (2004) 1.21 (0.72, 2.05) 1.21 (0.72, 2.05) 16.42 16.42 2.28 (1.43, 3.62) Random effect Fixed effect 2.11 (1.59, 2.80) .05 1 1 5 10 Odds ratio (95% CI)
Supplementary Figure 25. Detailed meta-analysis of Leu1007fsincC on the basis of allele frequencies. Crohn’s disease. Sporadic cases Study Crohn’s disease % OR (95% CI) Weight, Kugathasan S (2005) 7.06 (0.43, 115.39) 7.06 (0.43, 115.39) 2.09 2.09 Vermeire S (2002) 18.96 (2.56, 140.25) 18.96 (2.56, 140.25) 3.61 3.61 Buhner S (2006) 18.74 (2.53, 138.9) 5.71 5.71 Annese V (2005) 13.01 (3.92, 43.20) 13.01 (3.92, 43.20) 7.07 7.07 Tukel T (2004) 1.87 (0.60, 5.80) 1.87 (0.60, 5.80) 7.51 7.51 Cottone M (2006) 4.26 (1.82, 9.98) 4.26 (1.82, 9.98) 9.64 9.64 Helio T (2003) 2.16 (0.95, 4.92) 2.16 (0.95, 4.92) 9.89 9.89 Zhou Z (2002) 1.48 (0.67, 3.25) 1.48 (0.67, 3.25) 10.18 10.18 Cuthbert AP (2002) 3.23 (1.72, 6.10) 3.23 (1.72, 6.10) 11.55 11.55 Esters N (2004) 1.85 (1.12, 3.06) 1.85 (1.12, 3.06) 12.68 12.68 Hampe J (2001) 4.11 (2.59, 6.54) 4.11 (2.59, 6.54) 13.04 13.04 Random effect Fixed effect 3.41 (2.24, 5.20) 3.49 (2.77, 4.40) .05 1 1 5 10 50 Odds ratio (95% CI)
Supplementary Figure 26. Detailed meta-analysis of Arg702Trp heterozygotes versus non-carriers. Crohn’s disease. All studies. OR (95% CI) OR (95% CI) Weight Weight, % Crohn’s disease Study Kugathasan S (2005) 0.53 (0.06, 4.82) 0.53 (0.06, 4.82) 0.52 0.52 Zouiten-Mekki L (2005) 3.56 (0.41, 31.00) 3.56 (0.41, 31.00) 0.54 0.54 Ince AT (2008) 0.19 (0.02, 1.64) 0.19 (0.02, 1.64) 0.55 0.55 Vavassori P (2004) 0.76 (0.11, 5.47) 0.76 (0.11, 5.47) 0.64 0.64 Tukel T (2004) 7.52 (1.07, 52.83) 7.52 (1.07, 52.83) 0.66 0.66 Ozen SC (2006) 0.75 (0.13, 4.21) 0.75 (0.13, 4.21) 0.82 0.82 Bene J (2006) 3.23 (0.67, 15.68) 3.23 (0.67, 15.68) 0.95 0.95 Derakhshan F (2008) 23.59 (5.02, 110.98) 23.59 (5.02, 110.98) 0.98 0.98 Canto E (2007) 6.72 (1.51, 29.97) 6.72 (1.51, 29.97) 1.04 1.04 Gazouli M (2004) 12.25 (2.82, 53.26) 12.25 (2.82, 53.26) 1.07 1.07 Zaahl MG (2005) 2.64 (0.72, 9.66) 2.64 (0.72, 9.66) 1.31 1.31 Jess T (2005) 4.30 (1.20, 15.50) 4.30 (1.20, 15.50) 1.34 1.34 Economou M (2007) 2.26 (0.66, 7.77) 2.26 (0.66, 7.77) 1.41 1.41 Crawford NPS (2007) 4.90 (1.45, 16.58) 4.90 (1.45, 16.58) 1.44 1.44 Buhner S (2006) 2.46 (0.79, 7.68) 2.46 (0.79, 7.68) 1.60 1.60 Vind I (2005) 0.82 (0.28, 2.34) 0.82 (0.28, 2.34) 1.79 1.79 Rigoli L (2008) 4.76 (1.76, 12.89) 4.76 (1.76, 12.89) 1.94 1.94 Magyari L (2009) 2.35 (0.91, 6.11) 2.35 (0.91, 6.11) 2.06 2.06 Tukel T (2004) 1.72 (0.70, 4.26) 1.72 (0.70, 4.26) 2.20 2.20 Ferraris A (2006) 4.45 (1.84, 10.77) 4.45 (1.84, 10.77) 2.27 2.27 van der Linde K (2007) 1.58 (0.68, 3.69) 1.58 (0.68, 3.69) 2.40 2.40 Heresbach D (2004) 3.52 (1.52, 8.13) 3.52 (1.52, 8.13) 2.43 2.43 Rodrigo L (2007) 0.69 (0.30, 1.58) 0.69 (0.30, 1.58) 2.47 2.47 Buning C (2005) 2.36 (1.07, 5.20) 2.36 (1.07, 5.20) 2.60 2.60 Helio T (2003) 1.87 (0.87, 4.03) 1.87 (0.87, 4.03) 2.69 2.69 Braat H (2005) 3.08 (1.44, 6.59) 3.08 (1.44, 6.59) 2.71 2.71 Bianchi V (2007) 2.00 (0.99, 4.04) 2.00 (0.99, 4.04) 2.96 2.96 Lakatos PL (2005) 1.51 (0.78, 2.92) 1.51 (0.78, 2.92) 3.16 3.16 Leung E (2005) 1.56 (0.81, 3.00) 1.56 (0.81, 3.00) 3.19 3.19 Baptista ML (2008) 4.10 (2.14, 7.86) 4.10 (2.14, 7.86) 3.21 3.21 Giachino D (2004) 1.30 (0.71, 2.40) 1.30 (0.71, 2.40) 3.39 3.39 de Ridder L (2007) 2.71 (1.55, 4.75) 2.71 (1.55, 4.75) 3.67 3.67 Brant SR (2007) 2.96 (1.70, 5.15) 2.96 (1.70, 5.15) 3.70 3.70 Cucchiara S (2007) 3.19 (1.86, 5.47) 3.19 (1.86, 5.47) 3.77 3.77 Kugathasan S (2005) 1.28 (0.74, 2.19) 1.28 (0.74, 2.19) 3.78 3.78 Cuthbert AP (2002) 2.46 (1.44, 4.21) 2.46 (1.44, 4.21) 3.79 3.79 Ferreira AC (2005) 3.54 (2.09, 5.98) 3.54 (2.09, 5.98) 3.85 3.85 Oostenbrug LE (2006) 2.04 (1.26, 3.31) 2.04 (1.26, 3.31) 4.10 4.10 Cavanaugh JA (2003) 2.16 (1.36, 3.44) 2.16 (1.36, 3.44) 4.21 4.21 Ernst A (2007) 1.79 (1.13, 2.83) 1.79 (1.13, 2.83) 4.24 4.24 Hradsky O (2008) 1.44 (0.91, 2.27) 1.44 (0.91, 2.27) 4.25 4.25 Mascheretti S (2002) 1.72 (1.09, 2.70) 1.72 (1.09, 2.70) 4.29 4.29 Randomeffect Fixedeffect 2.24 (1.89, 2.64) 2.23 (1.99, 2.49) .1 .5 1 1 2 3 4 5 10 20 50 Odds ratio (95% CI)
Supplementary Figure 27. Detailed meta-analysis of Arg702Trp homozygotes versus non-carriers. Crohn’s disease. All studies. Weight, % Weight Study Crohn’s disease OR (95% CI) Canto E (2007) 1.93 (0.08, 48.27) 1.93 (0.08, 48.27) 2.22 2.22 Ince AT (2008) 0.38 (0.02, 9.57) 0.38 (0.02, 9.57) 2.23 2.23 Crawford NPS (2007) 1.48 (0.06, 36.65) 1.48 (0.06, 36.65) 2.23 2.23 Rodrigo L (2007) 1.22 (0.05, 30.38) 1.22 (0.05, 30.38) 2.23 2.23 Tukel T (2004) 9.00 (0.36, 223.22) 9.00 (0.36, 223.22) 2.24 2.24 Ferraris A (2006) 4.24 (0.17, 104.98) 4.24 (0.17, 104.98) 2.24 2.24 Vavassori P (2004) 2.28 (0.09, 56.45) 2.28 (0.09, 56.45) 2.24 2.24 Hradsky O (2008) 4.53 (0.18, 111.49) 4.53 (0.18, 111.49) 2.25 2.25 Buning C (2005) 7.63 (0.36, 160.12) 7.63 (0.36, 160.12) 2.49 2.49 Ernst A (2007) 10.92 (0.52, 228.16) 10.92 (0.52, 228.16) 2.50 2.50 Buhner S (2006) 4.07 (0.21, 80.27) 4.07 (0.21, 80.27) 2.59 2.59 Economou M (2007) 7.90 (0.40, 155.15) 7.90 (0.40, 155.15) 2.60 2.60 Giachino D (2004) 7.09 (0.36, 138.42) 7.09 (0.36, 138.42) 2.61 2.61 Brant SR (2007) 18.35 (1.01, 333.77) 18.35 (1.01, 333.77) 2.74 2.74 Cuthbert AP (2002) 9.51 (0.53, 169.60) 9.51 (0.53, 169.60) 2.78 2.78 Cavanaugh JA (2003) 26.05 (1.48, 458.34) 26.05 (1.48, 458.34) 2.80 2.80 Lakatos PL (2005) 13.33 (0.80, 223.39) 13.33 (0.80, 223.39) 2.90 2.90 Bene J (2006) 0.72 (0.04, 11.79) 0.72 (0.04, 11.79) 2.95 2.95 Heresbach D (2004) 0.55 (0.03, 8.86) 0.55 (0.03, 8.86) 2.97 2.97 Vind I (2005) 2.28 (0.14, 36.97) 2.28 (0.14, 36.97) 2.97 2.97 Bianchi V (2007) 1.00 (0.06, 16.14) 1.00 (0.06, 16.14) 2.98 2.98 Leung E (2005) 1.06 (0.07, 17.14) 1.06 (0.07, 17.14) 2.98 2.98 Magyari L (2009) 0.42 (0.04, 4.12) 0.42 (0.04, 4.12) 4.44 4.44 Ferreira AC (2005) 4.78 (0.49, 46.34) 4.78 (0.49, 46.34) 4.47 4.47 Kugathasan S (2005) 0.94 (0.10, 8.48) 0.94 (0.10, 8.48) 4.77 4.77 Cucchiara S (2007) 10.49 (1.22, 90.57) 10.49 (1.22, 90.57) 4.96 4.96 Braat H (2005) 3.03 (0.38, 24.46) 3.03 (0.38, 24.46) 5.28 5.28 de Ridder L (2007) 6.59 (0.83, 52.33) 6.59 (0.83, 52.33) 5.37 5.37 Mascheretti S (2002) 8.21 (1.06, 63.93) 8.21 (1.06, 63.93) 5.47 5.47 Oostenbrug LE (2006) 1.55 (0.30, 8.05) 1.55 (0.30, 8.05) 8.49 8.49 Baptista ML (2008) (Excluded) (Excluded) 0.00 0.00 Derakhshan F (2008) (Excluded) (Excluded) 0.00 0.00 Gazouli M (2004) (Excluded) (Excluded) 0.00 0.00 Helio T (2003) (Excluded) (Excluded) 0.00 0.00 Jess T (2005) (Excluded) (Excluded) 0.00 0.00 Kugathasan S (2005) (Excluded) (Excluded) 0.00 0.00 Ozen SC (2006) (Excluded) (Excluded) 0.00 0.00 Rigoli L (2008) (Excluded) (Excluded) 0.00 0.00 Tukel T (2004) (Excluded) (Excluded) 0.00 0.00 van der Linde K (2007) (Excluded) (Excluded) 0.00 0.00 Zaahl MG (2005) (Excluded) (Excluded) 0.00 0.00 Zouiten-Mekki L (2005) (Excluded) (Excluded) 0.00 0.00 Random effect Fixed effect 3.18 (1.97, 5.14) 3.85 (2.50, 5.93) .01 .5 1 1 2 5 10 20 50 100 800 Odds ratio (95% CI) Studies were excluded from meta-analysis if the risk allele/genotype was found neither in cases nor in controls.
Supplementary Figure 28. Detailed meta-analysis of Gly908Arg heterozygotes versus non-carriers. Crohn’s disease. All studies. I Study Crohn’s disease Weight, % OR (95% CI) Zaahl MG (2005) 0.80 (0.03, 20.02) 0.80 (0.03, 20.02) 0.31 0.31 Helio T (2003) 7.83 (0.40, 152.36) 7.83 (0.40, 152.36) 0.37 0.37 Canto E (2007) 6.01 (0.33, 110.83) 6.01 (0.33, 110.83) 0.38 0.38 Ince AT (2008) 0.61 (0.05, 6.92) 0.61 (0.05, 6.92) 0.54 0.54 Ozen SC (2006) 0.76 (0.07, 8.60) 0.76 (0.07, 8.60) 0.54 0.54 Bene J (2006) 3.58 (0.41, 31.65) 3.58 (0.41, 31.65) 0.66 0.66 van der Linde K (2007) 10.50 (1.35, 81.62) 10.50 (1.35, 81.62) 0.74 0.74 Crawford NPS (2007) 8.21 (1.07, 62.71) 8.21 (1.07, 62.71) 0.75 0.75 Jess T (2005) 2.38 (0.37, 15.11) 2.38 (0.37, 15.11) 0.90 0.90 Tukel T (2004) 4.22 (0.70, 25.63) 4.22 (0.70, 25.63) 0.94 0.94 Derakhshan F (2008) 5.44 (0.96, 31.01) 5.44 (0.96, 31.01) 1.00 1.00 Rodrigo L (2007) 1.29 (0.25, 6.50) 1.29 (0.25, 6.50) 1.14 1.14 Magyari L (2009) 5.88 (1.24, 27.75) 5.88 (1.24, 27.75) 1.23 1.23 Buhner S (2006) 2.73 (0.58, 12.85) 2.73 (0.58, 12.85) 1.24 1.24 Vind I (2005) 3.16 (0.69, 14.45) 3.16 (0.69, 14.45) 1.28 1.28 Heresbach D (2004) 2.06 (0.57, 7.43) 2.06 (0.57, 7.43) 1.73 1.73 Bianchi V (2007) 4.97 (1.41, 17.49) 4.97 (1.41, 17.49) 1.78 1.78 Queiroz DM, (2009) 5.45 (1.63, 18.16) 5.45 (1.63, 18.16) 1.91 1.91 Cuthbert AP (2002) 6.32 (1.90, 20.99) 6.32 (1.90, 20.99) 1.92 1.92 Ferraris A (2006) 5.14 (1.66, 15.89) 5.14 (1.66, 15.89) 2.13 2.13 Buning C (2005) 2.63 (0.86, 8.01) 2.63 (0.86, 8.01) 2.17 2.17 Zouiten-Mekki L (2005) 2.05 (0.71, 5.91) 2.05 (0.71, 5.91) 2.36 2.36 Vavassori P (2004) 2.42 (0.85, 6.84) 2.42 (0.85, 6.84) 2.42 2.42 Baptista ML (2008) 1.20 (0.43, 3.37) 1.20 (0.43, 3.37) 2.45 2.45 Giachino D (2004) 3.28 (1.17, 9.14) 3.28 (1.17, 9.14) 2.48 2.48 Cavanaugh JA (2003) 3.44 (1.29, 9.16) 3.44 (1.29, 9.16) 2.66 2.66 Leung E (2005) 1.93 (0.75, 4.96) 1.93 (0.75, 4.96) 2.82 2.82 Ferreira AC (2005) 1.88 (0.75, 4.76) 1.88 (0.75, 4.76) 2.89 2.89 Rigoli L (2008) 1.13 (0.46, 2.76) 1.13 (0.46, 2.76) 3.06 3.06 Brant SR (2007) 4.19 (1.73, 10.14) 4.19 (1.73, 10.14) 3.11 3.11 Gazouli M (2004) 4.89 (2.05, 11.65) 4.89 (2.05, 11.65) 3.18 3.18 Lakatos PL (2005) 1.84 (0.80, 4.23) 1.84 (0.80, 4.23) 3.38 3.38 Economou M (2007) 0.82 (0.37, 1.82) 0.82 (0.37, 1.82) 3.62 3.62 Ernst A (2007) 1.44 (0.66, 3.12) 1.44 (0.66, 3.12) 3.71 3.71 Tukel T (2004) 2.70 (1.37, 5.32) 2.70 (1.37, 5.32) 4.42 4.42 Braat H (2005) 0.87 (0.44, 1.70) 0.87 (0.44, 1.70) 4.49 4.49 Kugathasan S (2005) 4.50 (2.32, 8.72) 4.50 (2.32, 8.72) 4.56 4.56 Hradsky O (2008) 2.45 (1.26, 4.74) 2.45 (1.26, 4.74) 4.57 4.57 Cucchiara S (2007) 2.69 (1.43, 5.06) 2.69 (1.43, 5.06) 4.80 4.80 Oostenbrug LE (2006) 1.76 (0.96, 3.22) 1.76 (0.96, 3.22) 5.07 5.07 Mascheretti S (2002) 2.07 (1.13, 3.79) 2.07 (1.13, 3.79) 5.08 5.08 de Ridder L (2007) 1.40 (0.78, 2.53) 1.40 (0.78, 2.53) 5.20 5.20 Kugathasan S (2005) (Excluded) (Excluded) 0.00 0.00 Random effect Fixed effect 2.34 (1.95, 2.81) 2.33 (2.01, 2.71) .01 .5 1 1 2 3 5 10 20 50 100 400 Odds ratio (95% CI) Studies were excluded from meta-analysis if the risk allele/genotype was found neither in cases nor in controls.
Supplementary Figure 29. Detailed meta-analysis of Gly908Arg homozygotes versus non-carriers. Crohn’s disease. All studies. Study Crohn’s disease OR (95% CI) OR (95% CI) Weight Weigh, % Tukel T (2004) 35.31 (1.30, 956.57) 35.31 (1.30, 956.57) 4.56 4.56 Ozen SC (2006) 4.58 (0.18, 113.98) 4.58 (0.18, 113.98) 4.80 4.80 Gazouli M (2004) 3.21 (0.13, 79.74) 3.21 (0.13, 79.74) 4.81 4.81 Crawford NPS (2007) 0.16 (0.01, 4.00) 0.16 (0.01, 4.00) 4.82 4.82 Heresbach D (2004) 1.43 (0.06, 35.53) 1.43 (0.06, 35.53) 4.82 4.82 Vavassori P (2004) 2.42 (0.10, 59.89) 2.42 (0.10, 59.89) 4.82 4.82 Leung E (2005) 0.35 (0.01, 8.57) 0.35 (0.01, 8.57) 4.83 4.83 Ferreira AC (2005) 4.11 (0.17, 101.25) 4.11 (0.17, 101.25) 4.83 4.83 Bene J (2006) 3.59 (0.17, 76.52) 3.59 (0.17, 76.52) 5.31 5.31 Magyari L (2009) 6.52 (0.31, 137.23) 6.52 (0.31, 137.23) 5.35 5.35 Cucchiara S (2007) 9.66 (0.46, 202.40) 9.66 (0.46, 202.40) 5.37 5.37 Ferraris A (2006) 9.58 (0.49, 187.33) 9.58 (0.49, 187.33) 5.62 5.62 Braat H (2005) 3.00 (0.16, 56.11) 3.00 (0.16, 56.11) 5.79 5.79 Oostenbrug LE (2006) 0.29 (0.03, 3.25) 0.29 (0.03, 3.25) 8.58 8.58 Hradsky O (2008) 6.12 (0.68, 55.00) 6.12 (0.68, 55.00) 10.30 10.30 de Ridder L (2007) 1.08 (0.18, 6.52) 1.08 (0.18, 6.52) 15.39 15.39 Baptista ML (2008) (Excluded) (Excluded) 0.00 0.00 Bianchi V (2007) (Excluded) (Excluded) 0.00 0.00 Brant SR (2007) (Excluded) (Excluded) 0.00 0.00 Buhner S (2006) (Excluded) (Excluded) 0.00 0.00 Buning C (2005) (Excluded) (Excluded) 0.00 0.00 Canto E (2007) (Excluded) (Excluded) 0.00 0.00 Cavanaugh JA (2003) (Excluded) (Excluded) 0.00 0.00 Cuthbert AP (2002) (Excluded) (Excluded) 0.00 0.00 Derakhshan F (2008) (Excluded) (Excluded) 0.00 0.00 Economou M (2007) (Excluded) (Excluded) 0.00 0.00 Ernst A (2007) (Excluded) (Excluded) 0.00 0.00 Giachino D (2004) (Excluded) (Excluded) 0.00 0.00 Helio T (2003) (Excluded) (Excluded) 0.00 0.00 Ince AT (2008) (Excluded) (Excluded) 0.00 0.00 Jess T (2005) (Excluded) (Excluded) 0.00 0.00 Kugathasan S (2005) (Excluded) (Excluded) 0.00 0.00 Kugathasan S (2005) (Excluded) (Excluded) 0.00 0.00 Lakatos PL (2005) (Excluded) (Excluded) 0.00 0.00 Mascheretti S (2002) (Excluded) (Excluded) 0.00 0.00 Queiroz DM, (2009) (Excluded) (Excluded) 0.00 0.00 Rigoli L (2008) (Excluded) (Excluded) 0.00 0.00 Rodrigo L (2007) (Excluded) (Excluded) 0.00 0.00 Tukel T (2004) (Excluded) (Excluded) 0.00 0.00 van der Linde K (2007) (Excluded) (Excluded) 0.00 0.00 Vind I (2005) (Excluded) (Excluded) 0.00 0.00 Zaahl MG (2005) (Excluded) (Excluded) 0.00 0.00 Zouiten-Mekki L (2005) (Excluded) (Excluded) 0.00 0.00 Random effect Fixed effect 2.35 (1.16, 4.76) 2.35 (1.16, 4.76) 2.35 (1.26, 4.38) .01 1 1 5 10 50 100 200 Odds ratio (95% CI) Studies were excluded from meta-analysis if the risk allele/genotype was found neither in cases nor in controls.
Supplementary Figure 30. Detailed meta-analysis of Leu1007fsincC heterozygotes versus non-carriers. Crohn’s disease. All studies. Study Crohn’s disease OR (95% CI) OR (95% CI) Weight Weight, % Tukel T (2004) 55.00 (2.41, 1254.33) 55.00 (2.41, 1254.33) 0.24 0.24 Ozen SC (2006) 7.77 (0.37, 164.39) 7.77 (0.37, 164.39) 0.25 0.25 Zouiten-Mekki L (2005) 4.97 (0.25, 97.37) 4.97 (0.25, 97.37) 0.26 0.26 Guo QS (2004) 12.21 (0.72, 205.91) 12.21 (0.72, 205.91) 0.29 0.29 Ince AT (2008) 1.24 (0.08, 20.24) 1.24 (0.08, 20.24) 0.29 0.29 Kugathasan S (2005) 2.16 (0.13, 35.12) 2.16 (0.13, 35.12) 0.29 0.29 Zaahl MG (2005) 0.33 (0.04, 2.79) 0.33 (0.04, 2.79) 0.49 0.49 Canto E (2007) 4.40 (0.54, 36.25) 4.40 (0.54, 36.25) 0.50 0.50 Buhner S (2006) 14.28 (1.88, 108.68) 14.28 (1.88, 108.68) 0.54 0.54 Derakhshan F (2008) 2.58 (0.35, 18.97) 2.58 (0.35, 18.97) 0.55 0.55 Roussomoustakaki M (2003) 1.84 (0.30, 11.42) 1.84 (0.30, 11.42) 0.65 0.65 Queiroz DM, (2009) 9.20 (1.49, 56.67) 9.20 (1.49, 56.67) 0.66 0.66 Jess T (2005) 1.14 (0.24, 5.46) 1.14 (0.24, 5.46) 0.86 0.86 Bene J (2006) 3.50 (0.94, 13.01) 3.50 (0.94, 13.01) 1.17 1.17 Rodrigo L (2007) 1.77 (0.49, 6.38) 1.77 (0.49, 6.38) 1.23 1.23 Murillo L (2002) 7.16 (2.04, 25.17) 7.16 (2.04, 25.17) 1.27 1.27 van der Linde K (2007) 5.03 (1.43, 17.64) 5.03 (1.43, 17.64) 1.27 1.27 Bianchi V (2007) 6.08 (1.76, 21.03) 6.08 (1.76, 21.03) 1.29 1.29 Vavassori P (2004) 6.93 (2.03, 23.65) 6.93 (2.03, 23.65) 1.32 1.32 Leung E (2005) 11.87 (3.55, 39.65) 11.87 (3.55, 39.65) 1.36 1.36 Baptista ML (2008) 4.69 (1.50, 14.62) 4.69 (1.50, 14.62) 1.50 1.50 Radlmayr M (2002) 7.45 (2.44, 22.75) 7.45 (2.44, 22.75) 1.54 1.54 Ferraris A (2006) 6.61 (2.19, 19.94) 6.61 (2.19, 19.94) 1.57 1.57 Crawford NPS (2007) 2.62 (0.97, 7.05) 2.62 (0.97, 7.05) 1.86 1.86 Vind I (2005) 3.46 (1.34, 8.92) 3.46 (1.34, 8.92) 1.99 1.99 Rigoli L (2008) 3.93 (1.55, 9.95) 3.93 (1.55, 9.95) 2.05 2.05 Magyari L (2009) 3.85 (1.56, 9.51) 3.85 (1.56, 9.51) 2.13 2.13 Giachino D (2004) 1.92 (0.79, 4.65) 1.92 (0.79, 4.65) 2.21 2.21 Heresbach D (2004) 1.56 (0.68, 3.61) 1.56 (0.68, 3.61) 2.39 2.39 Buning C (2005) 3.99 (1.78, 8.94) 3.99 (1.78, 8.94) 2.51 2.51 Cavanaugh JA (2003) 5.97 (2.68, 13.32) 5.97 (2.68, 13.32) 2.53 2.53 Economou M (2007) 6.23 (2.86, 13.58) 6.23 (2.86, 13.58) 2.63 2.63 Ferreira AC (2005) 2.89 (1.33, 6.30) 2.89 (1.33, 6.30) 2.63 2.63 Helio T (2003) 2.34 (1.07, 5.09) 2.34 (1.07, 5.09) 2.64 2.64 Braat H (2005) 2.30 (1.06, 4.97) 2.30 (1.06, 4.97) 2.67 2.67 Tukel T (2004) 3.62 (1.70, 7.71) 3.62 (1.70, 7.71) 2.75 2.75 Cucchiara S (2007) 4.44 (2.13, 9.24) 4.44 (2.13, 9.24) 2.86 2.86 Gazouli M (2004) 3.62 (1.77, 7.40) 3.62 (1.77, 7.40) 2.95 2.95 Lakatos PL (2005) 3.98 (2.02, 7.82) 3.98 (2.02, 7.82) 3.16 3.16 Cuthbert AP (2002) 2.62 (1.35, 5.06) 2.62 (1.35, 5.06) 3.26 3.26 Ernst A (2007) 3.06 (1.67, 5.60) 3.06 (1.67, 5.60) 3.60 3.60 Brant SR (2007) 2.94 (1.61, 5.37) 2.94 (1.61, 5.37) 3.63 3.63 Oostenbrug LE (2006) 2.43 (1.37, 4.30) 2.43 (1.37, 4.30) 3.83 3.83 de Ridder L (2007) 1.77 (1.00, 3.12) 1.77 (1.00, 3.12) 3.85 3.85 Kugathasan S (2005) 6.87 (3.99, 11.84) 6.87 (3.99, 11.84) 4.03 4.03 Ogura Y (2001) 1.47 (0.87, 2.49) 1.47 (0.87, 2.49) 4.17 4.17 Hampe J (2001) 2.59 (1.56, 4.32) 2.59 (1.56, 4.32) 4.29 4.29 Mascheretti S (2002) 2.02 (1.26, 3.23) 2.02 (1.26, 3.23) 4.61 4.61 Hradsky O (2008) 3.11 (2.11, 4.57) 3.11 (2.11, 4.57) 5.37 5.37 Random effect Fixed effect 3.26 (2.80, 3.81) 3.26 (2.80, 3.81) 3.17 (2.82, 3.57) .01 .5 1 1 2 3 5 10 20 50 100 400 Odds ratio (95% CI)
Supplementary Figure 31. Detailed meta-analysis of Leu1007fsincC homozygotes versus non-carriers. Crohn’s disease. All studies. Study Crohn’s disease OR (95% CI) OR (95% CI) Weight Weight, % Crawford NPS (2007) 1.46 (0.06, 36.21) 1.46 (0.06, 36.21) 2.40 2.40 Vind I (2005) 0.83 (0.03, 20.71) 0.83 (0.03, 20.71) 2.40 2.40 Cucchiara S (2007) 5.85 (0.24, 144.41) 5.85 (0.24, 144.41) 2.41 2.41 Brant SR (2007) 4.81 (0.20, 118.74) 4.81 (0.20, 118.74) 2.41 2.41 Queiroz DM, (2009) 68.16 (3.22, 1444.37) 68.16 (3.22, 1444.37) 2.65 2.65 Gazouli M (2004) 5.57 (0.26, 117.70) 5.57 (0.26, 117.70) 2.65 2.65 Tukel T (2004) 16.90 (0.80, 356.20) 16.90 (0.80, 356.20) 2.66 2.66 Braat H (2005) 1.81 (0.09, 37.87) 1.81 (0.09, 37.87) 2.67 2.67 van der Linde K (2007) 5.56 (0.28, 109.39) 5.56 (0.28, 109.39) 2.79 2.79 Murillo L (2002) 9.39 (0.48, 183.55) 9.39 (0.48, 183.55) 2.80 2.80 Kugathasan S (2005) 32.41 (1.66, 631.50) 32.41 (1.66, 631.50) 2.80 2.80 Helio T (2003) 8.18 (0.42, 159.19) 8.18 (0.42, 159.19) 2.81 2.81 Bene J (2006) 7.28 (0.38, 138.67) 7.28 (0.38, 138.67) 2.85 2.85 Radlmayr M (2002) 14.07 (0.75, 265.20) 14.07 (0.75, 265.20) 2.87 2.87 Magyari L (2009) 12.73 (0.68, 239.21) 12.73 (0.68, 239.21) 2.87 2.87 Giachino D (2004) 9.22 (0.49, 172.55) 9.22 (0.49, 172.55) 2.88 2.88 Cavanaugh JA (2003) 15.34 (0.82, 286.26) 15.34 (0.82, 286.26) 2.89 2.89 Buhner S (2006) 7.16 (0.39, 131.78) 7.16 (0.39, 131.78) 2.91 2.91 Buning C (2005) 17.91 (0.98, 326.81) 17.91 (0.98, 326.81) 2.93 2.93 Mascheretti S (2002) 8.25 (0.45, 149.65) 8.25 (0.45, 149.65) 2.94 2.94 Heresbach D (2004) 6.52 (0.36, 117.04) 6.52 (0.36, 117.04) 2.96 2.96 Ferreira AC (2005) 18.77 (1.05, 335.00) 18.77 (1.05, 335.00) 2.98 2.98 Cuthbert AP (2002) 9.50 (0.53, 169.37) 9.50 (0.53, 169.37) 2.98 2.98 Vavassori P (2004) 13.56 (0.77, 239.92) 13.56 (0.77, 239.92) 2.99 2.99 Economou M (2007) 29.30 (1.66, 518.07) 29.30 (1.66, 518.07) 3.00 3.00 Ernst A (2007) 46.93 (2.74, 803.04) 46.93 (2.74, 803.04) 3.06 3.06 Ogura Y (2001) 16.92 (0.99, 288.44) 16.92 (0.99, 288.44) 3.07 3.07 Lakatos PL (2005) 12.09 (0.71, 204.40) 12.09 (0.71, 204.40) 3.09 3.09 Hampe J (2001) 44.78 (2.69, 744.74) 44.78 (2.69, 744.74) 3.13 3.13 Hradsky O (2008) 113.11 (6.88, 1859.45) 113.11 (6.88, 1859.45) 3.15 3.15 Oostenbrug LE (2006) 7.53 (0.97, 58.22) 7.53 (0.97, 58.22) 5.91 5.91 de Ridder L (2007) 1.73 (0.33, 8.99) 1.73 (0.33, 8.99) 9.10 9.10 Baptista ML (2008) (Excluded) (Excluded) 0.00 0.00 Bianchi V (2007) (Excluded) (Excluded) 0.00 0.00 Canto E (2007) (Excluded) (Excluded) 0.00 0.00 Derakhshan F (2008) (Excluded) (Excluded) 0.00 0.00 Ferraris A (2006) (Excluded) (Excluded) 0.00 0.00 Guo QS (2004) (Excluded) (Excluded) 0.00 0.00 Ince AT (2008) (Excluded) (Excluded) 0.00 0.00 Jess T (2005) (Excluded) (Excluded) 0.00 0.00 Kugathasan S (2005) (Excluded) (Excluded) 0.00 0.00 Leung E (2005) (Excluded) (Excluded) 0.00 0.00 Ozen SC (2006) (Excluded) (Excluded) 0.00 0.00 Rigoli L (2008) (Excluded) (Excluded) 0.00 0.00 Rodrigo L (2007) (Excluded) (Excluded) 0.00 0.00 Roussomoustakaki M (2003) (Excluded) (Excluded) 0.00 0.00 Tukel T (2004) (Excluded) (Excluded) 0.00 0.00 Zaahl MG (2005) (Excluded) (Excluded) 0.00 0.00 Zouiten-Mekki L (2005) (Excluded) (Excluded) 0.00 0.00 Random effect Fixed effect 9.59 (5.83, 15.77) 9.59 (5.83, 15.77) 12.17 (7.56, 19.59) .01 .5 1 1 10 50 100 200 600 Odds ratio (95% CI) Studies were excluded from meta-analysis if the risk allele/genotype was found neither in cases nor in controls.
Supplementary Figure 32. Detailed meta-analysis of NOD2/CARD15 simple heterozygtoes versus non-carriers. Crohn’s disease. All studies. Study Crohn’s disease OR (95% CI) OR (95% CI) Weight Weight, % Tukel T (2004) 20.00 (3.48, 115.02) 20.00 (3.48, 115.02) 0.74 0.74 Jess T (2005) 5.36 (1.84, 15.59) 5.36 (1.84, 15.59) 1.66 1.66 Derakhshan F (2008) 8.49 (2.92, 24.65) 8.49 (2.92, 24.65) 1.67 1.67 Buhner S (2006) 6.33 (2.34, 17.13) 6.33 (2.34, 17.13) 1.85 1.85 Torkvist L (2006) 3.40 (1.35, 8.61) 3.40 (1.35, 8.61) 2.04 2.04 Vavassori P (2004) 3.29 (1.55, 6.96) 3.29 (1.55, 6.96) 2.68 2.68 van der Linde K (2007) 2.72 (1.32, 5.58) 2.72 (1.32, 5.58) 2.81 2.81 Vind I (2005) 1.78 (0.89, 3.57) 1.78 (0.89, 3.57) 2.92 2.92 Rodrigo L (2007) 0.96 (0.49, 1.88) 0.96 (0.49, 1.88) 3.06 3.06 Ferraris A (2006) 4.23 (2.19, 8.17) 4.23 (2.19, 8.17) 3.10 3.10 Mendoza JL (2003) 2.34 (1.24, 4.40) 2.34 (1.24, 4.40) 3.25 3.25 Gazouli M (2004) 7.00 (3.73, 13.13) 7.00 (3.73, 13.13) 3.26 3.26 Heresbach D (2004) 1.93 (1.06, 3.51) 1.93 (1.06, 3.51) 3.41 3.41 Hugot JP (2001) 2.92 (1.63, 5.25) 2.92 (1.63, 5.25) 3.50 3.50 Helio T (2003) 2.38 (1.33, 4.25) 2.38 (1.33, 4.25) 3.53 3.53 Tukel T (2004) 3.11 (1.76, 5.50) 3.11 (1.76, 5.50) 3.60 3.60 Leung E (2005) 2.23 (1.32, 3.77) 2.23 (1.32, 3.77) 3.85 3.85 Giachino D (2004) 1.74 (1.05, 2.89) 1.74 (1.05, 2.89) 3.96 3.96 Braat H (2005) 1.92 (1.18, 3.12) 1.92 (1.18, 3.12) 4.10 4.10 Zhou Z (2002) 1.04 (0.64, 1.67) 1.04 (0.64, 1.67) 4.15 4.15 Annese V (2005) 2.42 (1.52, 3.86) 2.42 (1.52, 3.86) 4.23 4.23 Cavanaugh JA (2003) 1.42 (0.90, 2.23) 1.42 (0.90, 2.23) 4.32 4.32 Cuthbert AP (2002) 1.87 (1.21, 2.89) 1.87 (1.21, 2.89) 4.42 4.42 Arnot IDR (2004) 2.06 (1.33, 3.19) 2.06 (1.33, 3.19) 4.43 4.43 Lakatos PL (2005) 1.97 (1.29, 3.01) 1.97 (1.29, 3.01) 4.51 4.51 Brant SR (2007) 2.80 (1.84, 4.28) 2.80 (1.84, 4.28) 4.52 4.52 Ahmad T (2002) 2.40 (1.59, 3.63) 2.40 (1.59, 3.63) 4.59 4.59 Oostenbrug LE (2006) 1.96 (1.34, 2.85) 1.96 (1.34, 2.85) 4.84 4.84 Ernst A (2007) 2.06 (1.45, 2.93) 2.06 (1.45, 2.93) 5.00 5.00 Random effect Fixed effect 2.38 (2.03, 2.79) 2.38 (2.03, 2.79) 2.25 (2.04, 2.48) .01 .5 1 1 10 50 200 600 Odds ratio (95% CI)
Supplementary Figure 33. Detailed meta-analysis of NOD2/CARD15 compound heterozygtoes versus non-carriers. Crohn’s disease. All studies. Study Crohn’s disease OR (95% CI) OR (95% CI) Weight Weight, % Torkvist L (2006) 2.67 (0.11, 65.98) 2.67 (0.11, 65.98) 1.59 1.59 Derakhshan F (2008) 27.00 (1.35, 540.32) 27.00 (1.35, 540.32) 1.83 1.83 Vavassori P (2004) 6.77 (0.35, 132.43) 6.77 (0.35, 132.43) 1.86 1.86 Mendoza JL (2003) 9.76 (0.55, 173.08) 9.76 (0.55, 173.08) 1.99 1.99 van der Linde K (2007) 16.23 (0.92, 287.11) 16.23 (0.92, 287.11) 1.99 1.99 Ferraris A (2006) 36.91 (2.14, 637.74) 36.91 (2.14, 637.74) 2.02 2.02 Leung E (2005) 26.31 (1.53, 453.36) 26.31 (1.53, 453.36) 2.03 2.03 Gazouli M (2004) 63.16 (3.67, 1087.94) 63.16 (3.67, 1087.94) 2.03 2.03 Heresbach D (2004) 15.00 (0.88, 256.96) 15.00 (0.88, 256.96) 2.03 2.03 Brant SR (2007) 49.07 (2.89, 834.51) 49.07 (2.89, 834.51) 2.04 2.04 Jess T (2005) 2.50 (0.15, 42.44) 2.50 (0.15, 42.44) 2.05 2.05 Cavanaugh JA (2003) 90.78 (5.49, 1500.98) 90.78 (5.49, 1500.98) 2.09 2.09 Lakatos PL (2005) 25.92 (1.57, 427.92) 25.92 (1.57, 427.92) 2.09 2.09 Cuthbert AP (2002) 48.66 (2.96, 800.42) 48.66 (2.96, 800.42) 2.09 2.09 Hugot JP (2001) 26.80 (1.63, 440.33) 26.80 (1.63, 440.33) 2.10 2.10 Tukel T (2004) 12.50 (0.87, 179.32) 12.50 (0.87, 179.32) 2.31 2.31 Vind I (2005) 5.12 (0.46, 57.37) 5.12 (0.46, 57.37) 2.81 2.81 Helio T (2003) 2.45 (0.22, 27.14) 2.45 (0.22, 27.14) 2.83 2.83 Buhner S (2006) 4.06 (0.46, 35.75) 4.06 (0.46, 35.75) 3.47 3.47 Giachino D (2004) 5.81 (0.67, 50.37) 5.81 (0.67, 50.37) 3.52 3.52 Arnot IDR (2004) 8.77 (1.10, 69.69) 8.77 (1.10, 69.69) 3.82 3.82 Zhou Z (2002) 4.88 (0.65, 36.89) 4.88 (0.65, 36.89) 4.01 4.01 Ahmad T (2002) 43.12 (5.76, 322.99) 43.12 (5.76, 322.99) 4.05 4.05 Annese V (2005) 22.18 (2.97, 165.41) 22.18 (2.97, 165.41) 4.07 4.07 Ernst A (2007) 7.10 (1.42, 35.37) 7.10 (1.42, 35.37) 6.37 6.37 Braat H (2005) 3.51 (0.80, 15.45) 3.51 (0.80, 15.45) 7.48 7.48 Tukel T (2004) 5.11 (1.49, 17.45) 5.11 (1.49, 17.45) 10.88 10.88 Oostenbrug LE (2006) 4.95 (1.71, 14.32) 4.95 (1.71, 14.32) 14.56 14.56 Rodrigo L (2007) (Excluded) (Excluded) 0.00 0.00 8.98 (5.99, 13.47) 8.98 (5.99, 13.47) Random effect Fixed effect 12.63 (8.47, 18.83) .01 .5 1 1 10 50 200 500 Odds ratio (95% CI) Studies were excluded from meta-analysis if the risk allele/genotype was found neither in cases nor in controls.
Supplementary Figure 34. Detailed meta-analysis of NOD2/CARD15 homozygotes versus non-carriers. Crohn’s disease. All studies. OR (95% CI) OR (95% CI) Weight Weight, % Study Crohn’s disease Tukel T (2004) 64.71 (2.21, 1891.71) 64.71 (2.21, 1891.71) 1.95 1.95 Rodrigo L (2007) 1.28 (0.05, 31.81) 1.28 (0.05, 31.81) 2.14 2.14 Gazouli M (2004) 15.25 (0.77, 302.88) 15.25 (0.77, 302.88) 2.45 2.45 van der Linde K (2007) 6.68 (0.34, 132.00) 6.68 (0.34, 132.00) 2.46 2.46 Tukel T (2004) 29.55 (1.50, 581.73) 29.55 (1.50, 581.73) 2.47 2.47 Torkvist L (2006) 6.22 (0.32, 121.50) 6.22 (0.32, 121.50) 2.48 2.48 Helio T (2003) 8.56 (0.44, 166.48) 8.56 (0.44, 166.48) 2.48 2.48 Ferraris A (2006) 15.82 (0.84, 297.37) 15.82 (0.84, 297.37) 2.54 2.54 Mendoza JL (2003) 8.46 (0.47, 152.06) 8.46 (0.47, 152.06) 2.61 2.61 Brant SR (2007) 25.52 (1.43, 456.02) 25.52 (1.43, 456.02) 2.62 2.62 Buhner S (2006) 13.82 (0.78, 244.65) 13.82 (0.78, 244.65) 2.64 2.64 Giachino D (2004) 17.41 (0.98, 307.89) 17.41 (0.98, 307.89) 2.64 2.64 Vavassori P (2004) 18.36 (1.06, 319.16) 18.36 (1.06, 319.16) 2.67 2.67 Cavanaugh JA (2003) 42.61 (2.50, 727.03) 42.61 (2.50, 727.03) 2.70 2.70 Cuthbert AP (2002) 20.62 (1.21, 350.00) 20.62 (1.21, 350.00) 2.71 2.71 Ernst A (2007) 59.10 (3.49, 1001.40) 59.10 (3.49, 1001.40) 2.72 2.72 Hugot JP (2001) 18.86 (1.14, 312.08) 18.86 (1.14, 312.08) 2.76 2.76 Lakatos PL (2005) 29.83 (1.81, 490.84) 29.83 (1.81, 490.84) 2.77 2.77 Vind I (2005) 1.28 (0.11, 14.34) 1.28 (0.11, 14.34) 3.63 3.63 Leung E (2005) 0.63 (0.06, 6.99) 0.63 (0.06, 6.99) 3.65 3.65 Ahmad T (2002) 13.72 (1.67, 112.55) 13.72 (1.67, 112.55) 4.66 4.66 Heresbach D (2004) 4.79 (0.59, 39.02) 4.79 (0.59, 39.02) 4.68 4.68 Zhou Z (2002) 3.41 (0.44, 26.35) 3.41 (0.44, 26.35) 4.90 4.90 Braat H (2005) 5.78 (0.75, 44.50) 5.78 (0.75, 44.50) 4.91 4.91 Annese V (2005) 12.42 (1.62, 95.43) 12.42 (1.62, 95.43) 4.92 4.92 Arnot IDR (2004) 1.30 (0.29, 5.86) 1.30 (0.29, 5.86) 8.18 8.18 Oostenbrug LE (2006) 2.55 (0.93, 6.96) 2.55 (0.93, 6.96) 14.63 14.63 Derakhshan F (2008) (Excluded) (Excluded) 0.00 0.00 Jess T (2005) (Excluded) (Excluded) 0.00 0.00 Random effect Fixed effect 6.69 (4.13, 10.85) 6.69 (4.13, 10.85) 8.08 (5.33, 12.26) .01 .5 1 1 10 50 200 600 Odds ratio (95% CI) Studies were excluded from meta-analysis if the risk allele/genotype was found neither in cases nor in controls.