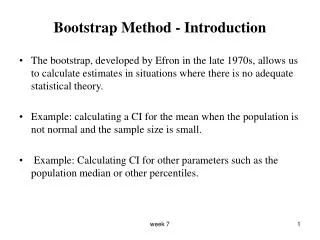
Bootstrap Distributions
Or: How do we get a sense of a sampling distribution when we only have ONE sample?. Bootstrap Distributions. Suppose we have a random sample of 6 people:. Bootstrap Sample : Sample with replacement from the original sample, using the same sample size. Original Sample. Bootstrap Sample.


Bootstrap Distributions
E N D
Presentation Transcript
Or: How do we get a sense of a sampling distribution when we only have ONE sample? Bootstrap Distributions
Bootstrap Sample: Sample with replacement from the original sample, using the same sample size. Original Sample Bootstrap Sample
Original Sample Create a “sampling distribution” using this as our simulated population
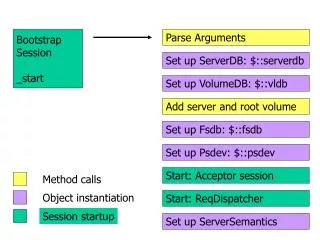
Create a bootstrap sample by sampling with replacement from the original sample. Compute the relevant statistic for the bootstrap sample. Do this many times!! Gather the bootstrap statistics all together to form a bootstrap distribution.
BootstrapSample Bootstrap Statistic BootstrapSample Bootstrap Statistic Original Sample Bootstrap Distribution . . . . . . Sample Statistic BootstrapSample Bootstrap Statistic
Example: Atlanta Commutes What’s the mean commute time for workers in metropolitan Atlanta? Data: The American Housing Survey (AHS) collected data from Atlanta in 2004.
Sample of n=500 Atlanta Commutes n = 500 29.11 minutes s = 20.72 minutes Where might the “true” μ be?
How can we get a confidence interval from a bootstrap distribution? Method #1: Use the standard deviation of the bootstrap statistics as a “yardstick”
Using the Bootstrap Distribution to Get a Confidence Interval – Version #1 The standard deviation of the bootstrap statistics estimates the standard error of the sample statistic. Quick interval estimate : For the mean Atlanta commute time:
Using the Bootstrap Distribution to Get a Confidence Interval – Version #2 95% CI=(27.35,30.96) Chop 2.5% in each tail Chop 2.5% in each tail Keep 95% in middle For a 95% CI, find the 2.5%-tile and 97.5%-tile in the bootstrap distribution
90% CI for Mean Atlanta Commute 90% CI=(27.64,30.65) Keep 90% in middle Chop 5% in each tail Chop 5% in each tail For a 90% CI, find the 5%-tile and 95%-tile in the bootstrap distribution
Bootstrap Confidence Intervals Version 1 (Statistic 2 SE): Great preparation for moving to traditional methods Version 2 (Percentiles): Great at building understanding of confidence intervals
StatKey can be found at www.lock5stat.com
Playing with StatKey! See the purple pages in the folder.
We want to collect some data from you. What should we ask you for our one quantitative question and our one categorical question?
What quantitative data should we collect from you? What was the class size of the Intro Stat course you taught most recently? How many years have you been teaching Intro Stat? What was the travel time, in hours, for your trip to Boston for JMM? Including this one, how many times have you attended the January JMM? ???
What categorical data should we collect from you? Did you fly or drive to these meetings? Have you attended any previous JMM meetings? Have you ever attended a JSM meeting? ??? ???
How do we assess student understanding of these methods (even on in-class exams without computers)? See the green pages in the folder.
Paul the Octopus http://www.youtube.com/watch?v=3ESGpRUMj9E http://www.cnn.com/2010/SPORT/football/07/08/germany.octopus.explainer/index.html
Paul the Octopus • Paul the Octopus predicted 8 World Cup games, and predicted them all correctly • Is this evidence that Paul actually has psychic powers? • How unusual would this be if he were just randomly guessing (with a 50% chance of guessing correctly)? • How could we figure this out?
Simulate! • Each coin flip = a guess between two teams • Heads = correct, Tails = incorrect • Flip a coin 8 times and count the number of heads. Remember this number! • Did you get all 8 heads? • (a) Yes • (b) No
Hypotheses Let p denote the proportion of games that Paul guesses correctly (of all games he may have predicted) H0: p = 1/2 Ha: p > 1/2
Randomization Distribution • A randomization distribution is the distribution of sample statistics we would observe, just by random chance, if the null hypothesis were true • A randomization distribution is created by simulating many samples, assuming H0 is true, and calculating the sample statistic each time
Randomization Distribution • Let’s create a randomization distribution for Paul the Octopus! • On a piece of paper, set up an axis for a dotplot, going from 0 to 8 • Create a randomization distribution using each other’s simulated statistics • For more simulations, we use StatKey
p-value • The p-value is the probability of getting a statistic as extreme (or more extreme) as that observed, just by random chance, if the null hypothesis is true • This can be calculated directly from the randomization distribution!
Randomization Test • Create a randomization distribution by simulating assuming the null hypothesis is true • The p-value is the proportion of simulated statistics as extreme as the original sample statistic
Coming Attractions - Friday • How do we create randomization distributions for other parameters? • How do we assess student understanding? • Connecting intervals and tests • Technology for using simulation methods • Experiences in the classroom
Using Randomization Methods to Build Conceptual Understanding of Statistical Inference:Day 2 Lock, Lock, Lock, Lock, and Lock Minicourse- Joint Mathematics Meetings Boston, MA January 2012
Cocaine Addiction • In a randomized experiment on treating cocaine addiction, 48 people were randomly assigned to take either Desipramine (a new drug), or Lithium (an existing drug) • The outcome variable is whether or not a patient relapsed • Is Desipramine significantly better than Lithium at treating cocaine addiction?
R R R R R R R R R R R R R R R R R R R R R R R R R R R R R R R R R R R R R R R R R R R R R R R R 1. Randomly assign units to treatment groups Desipramine Lithium R R R R R R R R R R R R R R R R R R R R R R R R R R R R R R R R R R R R R R R R R R R R
2. Conduct experiment 3. Observe relapse counts in each group R = Relapse N = No Relapse 1. Randomly assign units to treatment groups Desipramine Lithium R R R R R R R R R R R R R R R R R R R R R R R R R R R R R R R R R N R N R R R R R R R R R R R R R N R N N N N N N N N N R R R R R R R R R R R R N N N N N N N N N N N N N N N N N N N N N N N N 10 relapse, 14 no relapse 18 relapse, 6 no relapse
Randomization Test • Assume the null hypothesis is true • Simulate new randomizations • For each, calculate the statistic of interest • Find the proportion of these simulated statistics that are as extreme as your observed statistic
R R R R R R R R R R R R R R R R N N R R R R R R N N N N N N R R R R R R N N N N N N N N N N N N 10 relapse, 14 no relapse 18 relapse, 6 no relapse
R R R R R R R R R R R R R R R R N N R R R R R R N N N N N N R R R R R R N N N N N N N N N N N N Simulate another randomization Desipramine Lithium R N R N N N N R R R R R R R N R R N N N R N R R R N N R N R R N R N N N R R R N R R R R 16 relapse, 8 no relapse 12 relapse, 12 no relapse
Simulate another randomization Desipramine Lithium R R R R R R R R R R R R R N R R N N R R R R R R R R N R N R R R R R R R R N R N R R N N N N N N 17 relapse, 7 no relapse 11 relapse, 13 no relapse
Simulate! • Combine everyone into one group, and rerandomize them into the two groups • Compute your difference in proportions • Create the randomization distribution • How extreme is the observed statistic of -0.33? • Use StatKey for more simulations
StatKey Proportion as extreme as observed statistic observed statistic The probability of getting results as extreme or more extreme than those observed if the null hypothesis is true, is about .02. p-value
Cocaine Addiction • You want to know what would happen • by random chance (the random allocation to treatment groups) • if the null hypothesis is true (there is no difference between the drugs) • Why did you re-deal your cards? • Why did you leave the outcomes (relapse or no relapse) unchanged on each card?
Example: Mean Body Temperature Is the average body temperature really 98.6oF? H0:μ=98.6 Ha:μ≠98.6 Data: A random sample of n=50 body temperatures. n = 50 98.26 s = 0.765 Data from Allen Shoemaker, 1996 JSE data set article
Key idea: Generate samples that are(a) consistent with the null hypothesis (b) based on the sample data. How to simulate samples of body temperatures to be consistent with H0: μ=98.6?
Randomization Samples How to simulate samples of body temperatures to be consistent with H0: μ=98.6? • Add 0.34 to each temperature in the sample (to get the mean up to 98.6). • Sample (with replacement) from the new data. • Find the mean for each sample (H0 is true). • See how many of the sample means are as extreme as the observed 98.26.
Let’s try it on StatKey.
Is the number of penalties given to an NFL team positively correlated with the “malevolence” of the team’s uniforms?
Ex: NFL uniform “malevolence” vs. Penalty yards r = 0.430 n = 28 Is there evidence that the population correlation is positive?
Key idea: Generate samples that are(a) consistent with the null hypothesis (b) based on the sample data. H0 : = 0 r = 0.43, n = 28 How can we use the sample data, but ensure that the correlation is zero?