Download

1 / 70
700 likes | 974 Vues
INTERNATIONAL EQUITY MARKETS. 2. Practical Issues. Topics I’m interested. • Diversification: Going International - Stylized Facts and Correlations - Home Bias • Country Analysis – Country Risk - Emerging Markets - Risk Indicators • Factors affecting International Stock Markets

E N D
INTERNATIONAL EQUITY MARKETS 2. Practical Issues
Topics I’m interested • • Diversification: Going International • - Stylized Facts and Correlations • - Home Bias • • Country Analysis – Country Risk • - Emerging Markets • - Risk Indicators • • Factors affecting International Stock Markets • • International Stock Markets: Links • - Crash October ’87 • - High Volatility, High Correlations
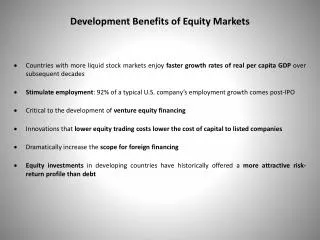
Why Go International? • • Diversification • If it is good to diversify in domestic markets, it is even better to • diversify internationally.
Q: Why does the frontier move in the NW direction? • A: Low Correlations! Low correlations are the key to achieve lower risk. • Empirical Fact #1: Low Correlations • The correlations across national markets are lower than the correlations across securities in most domestic markets. • • Return correlations are moderate. • - Average for developed markets: 0.42. • • Common economic policies matter: • - Average intra-European correlation: .57 • - Average intra-Asian correlation: .42 • • There is a regional (neighborhood) effect: • - Correlations between the US and Canada is .75. • - Correlations between the US and Japan is .35.
• Emerging Markets tend to have lower correlations. • -Average correlation with Canada: 0.507 • -Average correlation with Brazil: 0.375 • -Average correlation with Russia: 0.426 • -Average correlation with India: 0.431 • -Average correlation with China: 0.414
Empirical fact 2: Correlations are time-varying • Correlations change over time. • General finding: During bad global times, correlations go up • => when you need diversification, you tend not to have it!
Empirical fact 2: Correlations are time-varying • Correlations have increased over the last 10 years. • - Germany and France have become the same asset!
Empirical fact 2: Correlations are time-varying • It also true at the domestic level. JPMorgan: “Correlation Bubble”
Empirical fact 2: Correlations are time-varying • A “correlation bubble” is bad news for international (and domestic) investors: High correlations => more volatile portfolios. • • In addition, higher volatility => higher option premiums (higher insurance cost!). • • Investors like diversification. They look for low correlated assets: treasury bonds, commodities (gold, oil, etc.), real estate. • • But, diversification can work with highly correlated assets. • Example: The correlation between the U.S. and Canadian markets is .75. The RVAR of the U.S. market from 1970-2011 is .15, while the RVAR of a 50-50 portfolio with Canada is .18.
Empirical Fact 3: Risk Reduction • Past 12 stocks, the risk in a portfolio levels off, around 27%. For international stocks, the risk levels off at 12%
Empirical Fact 4: Returns Increase • Portfolios with international stocks have outperformed domestic portfolios in the past years. About 1% difference (1978-1993). • Q: Free lunch? • A: In the equity markets: Yes! Higher return (1% more), lower risks (2% less). • Example:. The U.S. market return and volatility from 1970-2011 were 7.71% and 15.62%, respectively (RVAR=.15). A portfolio with a 25% weight with Japan would have produced a market return and volatility of 8.32% and 14.53%, respectively. (RVAR=.23). • • Q: How to take advantage of facts 2 and 3? • A: True diversification: invest internationally.
Example: Lower Risk/Higher Returns! • Taken from H. Markowitz’s “A Random Walk Down Wall Street.”
Empirical Fact 5: Investors do not diversify enough • Latest report by UBS (2002) on the proportion of foreign bonds and foreign equities in the total equity and bond portfolio of local residents for several OECD countries: • - Most internationally diversified investors: Netherlands (62%), Japan (27%) and the U.K. (25%). U.S. ranks at the bottom of list: only 11%. • This empirical fact is called the Home Bias. • Proposed explanations for home bias and low correlations: • (1) Currency risk. • (2) Information costs. • (3) Controls to the free flow of capital. • (4) Country or political risk. • (5) Cognitive bias.
• Why do we have a separate market segment: Emerging Markets? • - Information problem problem is big. It involves financial, product, and labor markets. • - Distortionary regulation and/or inefficient regulation • - Judicial system not reliable (contracts enforcement a question mark) • • Labor markets - Problems • - Lack of educational institutions to train people • - No certification and screening • - Labor regulation that limits layoffs • - Solutions • - Groups provide training programs (group specific) • - Internal labor markets
• Why do we have a separate market segment: Emerging Markets? • • Regulation - Problems • - Too many regulations or unequal enforcement • - Solution • - Intermediation between government and individual companies. Lobbying & educating politicians. • • Judicial system - Problems • - Contracts not enforceable • - Solution • - International arbitration clauses • - Reputation for honest dealings
Related Question: What should be your international exposure? - GDP weighted?
Related Question: What should be your international exposure? - GDP weighted? - Market capitalization weighted?
Country Analysis • • Active allocation strategy requires the forecast of changes in economic variables: currencies, interest rates, and stock markets. • Key variable: Choice of a country (currency). • • Q: How do we select a country? • We perform country analysis. • Economists monitor a large number of variables such as: • - real growth (probably, the major influence on a national market.) • - monetary and fiscal policy • - wage and employment rigidities • - social and political situations
• Q: What are the main factors affecting the performance of a national stock market? • A: Many. But, in general, we find that growing economies have a growing national stock market. • • Many growing economies have significant risks: • - Information problems (accounting standards, communication culture) • - Government issues (corruption, regulations, inefficiencies.) • - Political environment (state intervention culture)
Emerging Markets • • Where are they emerging from? • - Investing in the developing world is not a new trend. The search for higher yields has always existed: Colonization of America in 1500s, UK building and financing railroads in 1800s, MNCs in 1900, etc. • - But trend is accelerating: In 2009, 43% of global FDIs went to EM.
• Very good economic growth: • - Between 1965 and 2010, the EM economies grew 1.8% faster IM economies. • - In its 2011 World economic outlook, the IMF expects EM to grow at a 6.5% in the 2011-2012 period, while IM are expected to grow at 2.5%.
• Spectacular stock market growth: • - 1983: EM market cap: USD 70 billion. Malaysia had the largest EM stock market: USD 22.8 billion. Second was Brazil: USD 15.1 billion. • - 2010: EM market cap: USD 16.5 trillion. The Chinese, Brazilian and Indian stock markets were among the 10 largest markets in the world. • - Growth in trading volume: 1,400 times from the 1980 level. • - High Returns: 1988-2011 annualized USD return of the MSCI EM nd 2011 was 28.5%, which is bigger than the annualized return of 7% for the S&P 500 Index over the same time period. • • Keep in mind: High returns, high volatility • From 1988 to 2011, the MSCI Latin American Index had an annualized return of 22.62% and a SD of 31.46%. For the S&P 500, the same numbers were 8.37% and 14.95%. 
• Why this growth in market cap?: • (1) More market-oriented policies in EM . • (2) More economic sectors open to competition and foreign investments • (3) Restructuring of the corporate sector and changes in laws and regulations, making numerous EM companies more competitive and responsive to markets and shareholders. • (4) The privatization of state-owned enterprises (SOEs). In the 1990s, following the UK, many EM adopted wholesale privatization programs. • (5) The re-emergence of state-directed capitalism. In the 2000s, many EM countries changed management for SOEs: from bureaucrats and cronies to professional managers. The SOEs act more like a private companies. SOEs account for 80% of the value of China’s market cap. SOEs are attractive to international investors: 30% of FDI in 2003-10. • (6) The list of stock markets in the developing countries in which an international investor might invest is growing. As stock markets are being created in countries where they had not
Country Risk • Definition: Country Risk • Country risk (CR) represents the risk attached to a borrower/investor by virtue of its location in a particular country. • Q: Why do we care about CR? • - MNCs make decisions on DFI projects on the basis of NPVs. • - MNCs use discount rates to establish NPV for projects • (the higher the discount rate, the lower the chances of a project to have a NPV>0). • Q: Where do discount rates come from? • A: For projects abroad, a key element is Country risk (CR)
Note: CR is different than FX risk. CR risk can be zero and FX can be huge for a given country. The reverse, though unusual, can also happen. • CR reflects the (potentially) negative impact of a country’s economic and political situation on an MNC’s or an investor’s cash flows. • • Situations that can affect MNC’s Cash flows • - Nationalization of subsidiaries or joint ventures. • - Labor strike in an industry. • - A political scandal that introduces new laws or regulations. • - New trade restrictions, limiting imports or exports. • Q: Does country risk analysis matter? • A: Look at companies investing in Libya in 2011! Value of Libyan assets went down significantly. Global investors, MNCs, bondholders realize the relevance of country risk analysis.
• Measures to reduce country risk: • - A cap on the total amount invested in a particular country. • - Diversification. • • Basic Idea • There are many factors that can influence a country’s economic policies: political, economic, social, etc. • We want to create a global indicator that assesses the likelihood of a (negative) change in a given country’s economic policy. • This indicator, reported as a single number, is called country risk (CR). • Similar to credit risk ratings, CR is usually measured (and reported) as a letter (A=excellent, C=bad) => Letter = Grade
• Credit and Interest Rate Risk for Bonds: Brief Review • Bonds are subject to two types of risk: • 1) interest rate risk (risk associated to changes in interest rates) • 2) credit/default risk (risk associated to the probability of default combined with the probability of not receiving principal and interest in arrears after default) • Credit rating agencies describe (measure) the risk with a credit rating (a letter grade). • Rule: The higher the grade, the lower the yield of the bond (measured as a spread over risk-free rate). (For us, the risk-free rate is the yield of government bonds).
• General Idea • From a big data set (with a lot of economic, socioeconomic and political variables and observations), we come up with a single measure (a letter). • • Two approaches to measure CR (and get a grade) • (1) Qualitative – collect data, get an opinion from “experts,” form a “consensus” grade. • (2) Quantitative – collect data, process the data with a computer model, get a grade. • (1) Qualitative Approach: Talk to experts (politicians, union members, economists, etc) to form a consensus opinion about the risk of a country. The consensus opinion becomes the grade. • (2) Quantitative Approach: Start with some quantifiable factors that affect CR. Use a formula to determine numerical scores for each factor. Calculate a weighted average of the factors’ numerical scores. This weighted average determines the final grade.
(1) Qualitative Approach is considered “subjective.” • (2) Quantitative Approach is considered (or seems more) “objective.” • We will emphasize the Quantitative Approach. • • Pros • - It is simple • - It allows cross-country and across time comparison. • • Cons • - It is too simple. • - In practice, ratings tend to converge (herding). • - Not a lot of predictive power. • Note: Ideally, rating companies are independent. But, they have incentives to accommodate clients (countries).
• Practical use of CR • • We will associate CR to the spread over a base, risk-free rate, say U.S. T-bills. That is, CR influences the interest on the debt issued by a government of a country (and the discount rate on foreign projects!). • Example: Setting yields for Mexico (actually, the Mexican government) • Yield on Mexican government debt = US Treasuries + spread (risk premium, a function of CR) • Mexico’s grade: BBB -a spread of 140 bps (1.40%) over US Treasuries • US Treasuries yield 4% => YieldMex = 4% + 1.40% = 5.40% • If we have a project in Mexico, to calculate the discount rate, the YieldMex becomes the risk-free reference rate. That is, • Discount Rate ProjectMex = YieldMex + project’s risk premium. 
What explains the difference between the yields in Germany and Italy? Country Risk.
Risk Rating Method (Check list) • • Weighted average of grades for four major aspects of a country: • - Economic Indicators (financial condition) • - Debt management (ability to repay debt) • - Political factors (political stability) • - Structural factors (socioeconomic conditions) • The grades (between 0 and 100) for each factor are a function of “fundamental data.” For example, the economic indicator’s grade depends on GDP per capita, GDP growth, inflation, interest rates, etc. • A specific formula is used to compute the grades. For example, • Score(EI) = α0 + α1 GDP growth + α2 Inflation + α3 Productivity + .... • Regressions and experience will determine the coefficients (α0, α1, α2,...).
Risk Rating Method (Check list) • We expect better GDP growth and lower inflation to have a positive and negative coefficient, respectively. • • The final score –i.e., the CR letter- will be determined by a weighted average: • Final Score = wEI Score(EI) + wDM Score(DM) + wPF Score(PF) + wSF Score(SF) • Note: The weights should be positive and should up to 1 –i.e., wEI + wDM + wPF + wSF = 1. • Q: Where are the weights and the formulae for the grades coming from? • A: This method seems more “objective,” because it is based on hard economic data, but weights and formula for grades might be “subjective.” It’s more an art, than a science.
The model can deliver different forecasts: Short-term, Medium-term, and Long-term. • => The weights and grades can change depending on your horizon. • For example: • (a) Short-term: more weight to debt management and political factors. • (b) Long-term: more weight to economic indicators and structural factor. • Each grade is associated with a spread in basis points (bps) over base rate, usually a risk free rate.
• If a country is rated as A, its bond will trade at base rate plus a (80-130) bps spread. • Note I: A rating of BBB or better is considered “investment grade.” • Note II: A rating of BB or less is considered “junk.” In the U.S., the usual spread of junk debt is between 400 to 600 bps over 1-yr T-bills. Range is very wide: Spreads can go over 2600 bps.
Example: Spread on government eurobonds: July 21. 2011. • Higher risk (PIIGS), higher spread! 
Example:Bertoni Bank evaluates the country risk of country DX. Short-term Horizon Medium-term Horizon FactorWeight Grade Weight Grade Economic .3 80 24 .3 70 21 Debt managt .3 90 27 .2 70 14 Political .3 67 20.1 .2 50 15 Structural .1 75 7.5 .3 60 12 Total 78.663 Short-term ranking: A Medium-term ranking: BBB That is, the short-term debt of country DX will get a spread in the 80-130bps range, say 93 bps over US Treasuries; while the medium-term debt will get a higher spread, say 128 bps. Suppose the short-term US Treasuries yield 4% (s.a.). Then, the short-term debt of country DX yields 4% (s.a.) + 0.93% (s.a.) = 4.93% (s.a.) 
Example: Country Risk in Practice Euromoneyproduces semi-annual country risk analysis of 185 countries using a panel of a experts. Euromoney rates nine categories with a score (0 to 100). • Categories and weights: Economic performance: GDP growth - 25% weight Political Risk - 25% weight Debt indicators: Debt/GDP -10%weight Debt in default or rescheduled -10%weight Credit rating: Moody ’s or S&P’s or Fitch IBCA’s rating -10%weight Short-term credit market access - 5% weight Acces to bank finance: Commercial bank credit - 5% weight Access to Capital markets - 5% weight Discount default factor: Spread over US Treasury bills: - 5% weight
Example: Country Risk in Practice Euromoney’s experts evaluate each category for each country and grade them from 0 to 100. For example, they look at the category: Debt Indicator (10% weight) and grade it:
Example: Euromoney, World Country Risk Jan 30, 2012 World Country Risk weighted average: 44.50 (B rating or Tier 4)
Example: Country Risk in Practice • Euromoney CR ratings - Congo 2011: 28.89 (World ranking: 139. In 2001, Congo ranked 180th.) - Romania 2011: 49.09 (World ranking: 72. In 2001, Romania ranked 89th.) - China 2011: 63.55 (World ranking: 40. In 2001, China ranked 45th.) - Taiwan 2011: 80.04 (World ranking: 18. In 2001, Taiwan ranked 28th.) - Singapore 2011: 87.48 (World ranking: 6. In 2001, Singapore ranked 14th.) • As expected, there is a wide dispersion of CR across countries. Ratings, however, tend to be persistent over time.
Other Country Risk Indicators • • Given the lack of predictive power of CR, a single indicator may not be enough. There are other indexes that may be also signal the true riskiness of a country –i.e., they can be correlated with the CR. • • Popular indicators • - A.T. Kearny: Globalizaton Index (it measures a country’s global links) - A.T. Kearny: FDI confidence index (survey of MNFs indicating the likelihood of investment in specific markets). • - World Economic Forum: Global competitiveness index (it uses to indexes to rate growth environment and opportunities). • - Institute for Management DevelopmentWorld Competitiveness index. • - PWC: Opacity Index (it measures the adverse impact of opacity of capital -the cost of borrowing funds- in different countries). • - Heritage Foundation: Index of economic freedom (absence of government obstructions).
Other Country Risk Indicators • • Popular indicators • - Fraser Institute: Index of Economic Freedom • - UNDP: Human Development Index (HDI is a composite index measuring average achievement in life expectancy, education, and standard of living). • - Nord Sud Export (NSE) index (market potential assessment for foreign investor
Other Country Risk Indicators • • Popular indicators: Summary • In general, we see countries’ rankings moving in a similar range (say, Japan is between 9 and 28; UK between 2 and 20); but it is not always the case. The economic freedom rankings of Brazil and China make huge intervals for these countries, far away from the others.


![STOCK [EQUITY] MARKETS](https://cdn1.slideserve.com/1829202/stock-equity-markets-dt.jpg)