Download
1 / 27
270 likes | 408 Vues
NEAR-EARTH TRAJECTORY OF CME DEDUCED FROM COSMIC RAYS. K. MUNAKATA , T. Kuwabara, J. W. Bieber, P. Evenson, R. Pyle, S. Yasue, C. Kato, Z. Fujii, M. L. Duldig, J. E. Humble, M. R. Silva, N. B. Trivedi, W. D. Gonzalez, and N. J. Schuch. Prototype network (2001~). Data used.

E N D
NEAR-EARTH TRAJECTORY OF CME DEDUCED FROM COSMIC RAYS K. MUNAKATA, T. Kuwabara, J. W. Bieber, P. Evenson, R. Pyle, S. Yasue, C. Kato, Z. Fujii, M. L. Duldig, J. E. Humble, M. R. Silva, N. B. Trivedi, W. D. Gonzalez, and N. J. Schuch
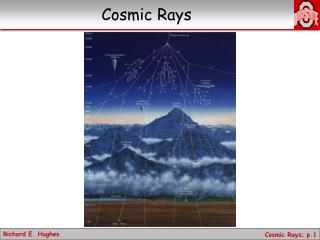
Data used Three CMEs in 2001
H. Cane SpaceSci. Rev., 93, 2000 Cosmic-ray depleted region
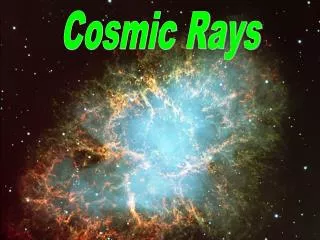
Cosmic-ray intensity variations observed ( 9 – 14 April, 2001 )
Cosmic-ray storms CME, Shock Cosmic-ray storms • isotropic intensitydecreases • Forbush Decrease • anisotropyenhancements • B×Gradient anisotropy ⇒ deduction of CME trajectory
B×Gradientanisotropy : IMF unit vector : density gradient vector ecliptic plane : Larmor radius ~0.2 AU for muons ーG⊥ pointing toward CME center
CR observation RLGx RLGy RLGz April 11, 2001 August 27, 2001
Vapp Vax sun Vcy • Assume the axisymmetric CR density distribution with the minimum along with the axis of a straight cylinder • Then the observed –Gpoints toward the Closest Axial Point (CAP) located on the axis • Assume the cylinder moving withVcy, parallel to the average solar wind velocity • Then the velocity Vax representing the cylinder orientation can be deduced from the apparent velocityVapp, as • Vax =Vapp - Vcy Cylinder model earth -G CAP cylinder axis
Assume the gaussian distribution for CR density, as (1) : distance from the cylinder axis I0 : maximum density suppression (%), l: radial scale of the cylinder earth λ -G • Then G(E) observed at the earth ( E) is… E CAP (2) E: distance between the earth & the CAP cylinder axis • With the observed G(E), Ecan be calculated • from (2) for each set of parameters, I0 & l • Find a set of I0 & l giving the best-fit G(E) to • the observed gradient
Derived CME geometry (GSE) April 11, 2001 August 27, 2001 ZGSE ZGSE XGSE XGSE ZGSE YGSE
Summary • 4/11 CME • Fast CAP hit the earth moving northward • 8/27 CME • CAP passed the south of earth • 11/6 CME • CAP looks like “revolving” around the axis, • possibly related to the IMF “rotation”
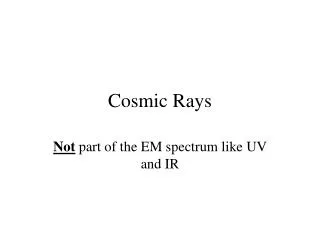
primary cosmic rays Upper atmosphere p n n n n p m n n e p m n n m Neutron Monitor Muon Detector
Sao Martinho muon observatory (INPE/SSO, Brazil) In operation since March 2001
Intensity deficit confined in a cone Loss-cone precursors Nagashima et al. [1992], Ruffolo [1999]