Poverty and Economic Development for a Better Society
Explore the concept of poverty, its types, measurement methods, and factors affecting economic development to build a fairer world. Discover Amartya Sen's insights on human development and freedom.

Poverty and Economic Development for a Better Society
E N D
Presentation Transcript
What do you think poverty means and how do you recognise it?Think about some of the work we have been doing on GDP and the standard of living
Amartya Sen 1933 - present Nobel Prize winner for Economics 1998 Founder of the Human Development Index and The Human Development Report
Development as Freedom: Sen 1999 “Development requires the removal of major sources of unfreedom: poverty as well as tyranny… Despite unprecedented in overall opulence, the contemporary world denies elementary freedom to vast numbers – perhaps even the majority of people …”
THE HUMAN DEVELOPMENT INDEX There are three basic goals of development that can be measured: • A long and healthy life – life expectancy • Improved education – adult literacy rates • A decent standard of living All of these goals relate to a reduction in poverty But …. What do we mean by poverty?
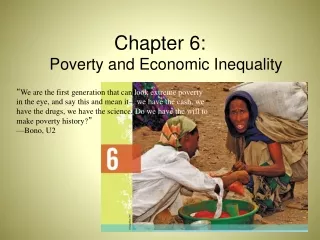
Poverty • Absolute Poverty: A situation where individuals do not have access to the basic requirements of life – food, shelter, clothing. • Relative Poverty: A situation where individuals are excluded from being able to take part in what are considered the normal, acceptable standards of living in a society.
Poverty It is difficult to draw a line between those ‘in poverty’ and those outside. • What do we mean by food, clothing and shelter? • Is living in a sewer a form of shelter? • Does having some clothing mean that you are not experiencing absolute poverty?
Relative Poverty In the UK the low income threshold is set at: 60% of the median income. This means 12.5 million people living below this level – but is this really a poverty line? • There certainly are links between ‘low pay’ and health, crime, education levels, social problems. • These represents a significant ‘social cost’ (negative externality) to the government
Measurements of Income Distribution Lorenz Curve: • A curve showing the proportion of national income earned by a given percentage of the population. • e.g what proportion of national income is earned by the top 10% of the population?
Lorenz Curve % of National Income This line represents the situation if income was distributed equally. The poorest 10% would earn 10% of national income, the poorest 30% would earn 30% of national income. 30% 10% 10% 30% Percentage of Population
Lorenz Curve % of National Income In this second example, the Lorenz curve lies further below the line of equality. Now, the poorest 30% only earn 7% of the national income. The Lorenz Curve will show the extent to which equality exists. The greater the gap between the line of equality and the curve the greater the degree of inequality. In this example, the poorest 30% of the population earn 20% of the national income. 20% 7% Percentage of Population 30%
Gini Coefficient • Enables more precise comparison of Lorenz Curves • The proportion of the area taken up by the Lorenz Curve in relation to the overall area under the line of equality
The total area under the line of equality Gini Coefficient % of National Income The area bounded by the Lorenz Curve Percentage of Population
We could use the Gini coefficient to examine differences between countries, but also to compare differences within countries and drive social policy
Gini Coefficients in North Carolina Countiesin the Year 2000 High Inequality Low Inequality
Causes of Inequality Inequality can be at a number of levels. • Individual • National • Regional
Individual There are a number of factors which influence the level of wealth: • Ownership of resources – housing, land, etc. • Qualifications • Motivation • Skills • Ability • Family size • Ethnic group
National There are a number of factors that will influence the wealth of a nation and allow it to be categorised e.g. MEDC, NIC,LEDC • Factor endowments (land, labour, capital) • Size and quality of labour force • Climate • Stage of economic development • Economic Power – ability to be able to dictate terms with suppliers, buyers, etc. • History – e.g. a colonial past – most of Africa
Regional As we have seen, we can use the Gini Coefficient to show varying poverty within countries. Influencing factors may include: • Ethnicity • Social Class • Access to education and health • Corruption • Crime