Download
1 / 24
340 likes | 625 Vues
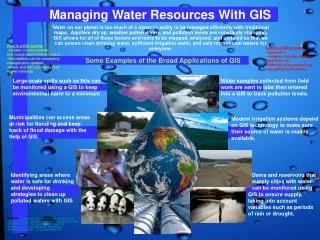
International Conference on the Water-Food-Energy Nexus in Drylands : Bridging Science and Policy Rabat, 11-13 June, 2014. A global view of managing water resources in Tunisia. Jamel Chahed

E N D
International Conference on the Water-Food-Energy Nexus in Drylands : Bridging Science and Policy Rabat, 11-13 June, 2014 A global view of managing water resources in Tunisia Jamel Chahed Professor, Tunis El Manar University, National Engineering School of Tunis Mustapha Besbes Emeritus Professor, Tunis El Manar University, National Engineering School of Tunis (ENIT) Abdelkader Hamdane Professor, Agronomic Institut de Tunis, (INAT), Former General Director of Rural Engineering and Water Management and Exploitation (MARH) jamel.chahed@enit.rnu.tn mbf.besbes@gnet.tn Abdelkader.hamdane@gmail.com
Average rainfall Tunisian water resources • Pluvial water resources • 36000 Mm3 225 mm/year • Renwable Water Resources • 4850 Mm3 < 500 m3/cap/year • Surface water : 2700 Mm3 • Ground water : 2150 Mm3 • Non-Conventional water resources • 120 Mm3 TWW (Treated Waste Water)
Tunisian water resources : Transfers and Water uses Water Uses Drinking Water: 400 Mm3 ≈ (40 m3/Cap/year) Water for Industry: 100 Mm3 ≈ (10 m3/Cap/year) Water for Tourism: 50 Mm3 ≈ (5 m3/Cap/year) Water for Agriculture : 2100 Mm3≈ (210 m3/Cap/year) Rate of water withdrawal Global ≈ 90 % Surface water ≈ 85 % Groundwater ≈ 95 %
Water resource development and management in Tunisia • Water resources in Tunisia are scares, not uniformly distributed and highly withdrawn • Water withdrawal has reached the water potential especially for groundwater • The direct demand (drinking water, industry, tourism) is incompressible and increases with the population but still moderate • An important part of «Blue Water» is used in agriculture : As water supply stabilizes agricultural water allocations will be reduced. This is the key question that determines the water policy in Tunisia
Blue Water for Irrigation (BW)Trends in agricultural water use, 1990–2006 Direct water uses (collectivities, tourism, industry) - Represent around 20 % of water uses • - Benefit from a priority in the water • allocation • Irrigated Agriculture • - Uses more than 80 % of water. - Occupies 1/10 of cultivated areas • - Produces 1/3 of food production • Rainfed Agriculture - Occupies 9/10 of cultivated areas • - Produces 2/3 of food production in value • - has not received as much attention as irrigated agriculture
1400000 Wheat cultivated area [ha] 1200000 1000000 800000 600000 400000 200000 0 1975 1976 1977 1978 1979 1980 1981 1982 1983 1984 1985 1986 1987 1988 1989 1990 1991 1992 1993 1994 2003 2004 2005 2006 2007 1961 1962 1963 1964 1965 1966 1967 1968 1969 1970 1971 1972 1973 1974 1995 1996 1997 1998 1999 2000 2001 2002 Green Water (GW) Rainfed agriculture : Olive groves and wheat sown area
Water and food security issues in Tunisia • Irrigation has been the key of agriculture development. An important part of withdrawal water «Blue Water» is used in agriculture (more than 80%). • Rainfed agriculture «Green Water» plays an important role in food security. It takes an important part in food trade balance. But rainfed agriculture has not received the same attention as irrigated agriculture and its contribution is not directly taken into account in the global balance of water resources • Imports of cereals, edible oil and other basic foodstuffs «Virtual Water» is required to fill the deficit of the local production. The part of Virtual Water is already important and it is expected to increase significantly. • How improve Food Security ? • Should first improve the knowledge of the different contributions to the provision of food
Green Water assessment GW(i,n): Green Water of rainfed production (region (i), year (n)) z : Specific Equivalent Water [m3/kg]; YG(i,n) : Yield of rainfed production [ton/hectare] SG(i,n) : Environmental Water demand At the national level
Green Water assessment (Cereals Olives) Potential of "Green Virtual-Water" content of rain-fed agriculture in Tunisia.
A field of olive trees, near Sfax, Tunisia 100 m Average Rainfall # 250 mm/y
Water-equivalent of animal production • Sustained policy for increasing animal production has led to a significant development of the sector • Tunisia proudly displays a relative self-sufficiency in animal products since the early 2000s • and even there are signs of overproduction during the last period
“….Déversement de lait sur la RN 17 !... http://www.tunivisions.net/28299/152/149/instauration-du-blocage-des-routes-deversement-de-lait-sur-la-rn-17-ou-va-t-on-ij.html • Protests against the difficulties of milk marketing: producers discharge milk on the public way (Mars 2014) • But this abundance is not real : lets analyze the imports (in water-equivalent) of animal products and of fodder
Imports in water-equivalent of animal products and of fodder • the decrease in imports of animal products that began in the late 1980s was accompanied by a significant amplification of animal feed imports in the early 1990s : so that the deficit in equivalent-water is significantly incresed
Evolution of the specific food demand (water-equivalent) • Water requirements for food have increased from about 1000 m3/year/capita in the early 1970s to more than 1500 m3/year/capita in the last 2000s • Diet has changed : the consumption of animal products increased more rapidly than that of vegetal products Taking into account the relatively low level of the actual animal products consumption, we may expect in the coming years more change of the diet accompanied with an increase of the water requirement for food needs increasing the equivalent-water imports
Evolution of the food trade balance (water-equivalent) • The coverage rate of food imports gradually deteriorated in connection with the increase in imports of agro-alimentary products • The water-equivalent of the food trade balance is very favourable to Tunisia: the coverage rate of the food trade balance, which reached in value around 80% in the late 2010s, represents less than 30% in water-equivalent
Average Global Water Balance Blue Water 3,3 Irrigation 2,1 Urban [Cities, tourism] 0,4 Industry 0,1 Environment [conservation of humid areas] 0,1 Water Bank [Storage in dams for droughts] 0,6 Green Water 12,1 Rainfed agriculture 6,6 Forests and Rangelands 5,5 Net Virtual Water 6,3 Deficit of food balance[Imported Virtual Water] 6,3 Total Water Demand 22,5 Food Water Demand 15,8 Direct Water demand (Collectivities, Industry, Tourism) 0,5 Water Bank [Storage in dams for droughts] 0,6 Environmental Water demand 5,6
Improvement of the global water balance • Enlargement of the Water Resourcenotion to all kind of the contributions to the Global Water Balance : «Blue Water», «Green Water», «Virtual Water», «Non-conventional Water». • Enlargement of the Demand Management notion to all kind of water uses including the water requirements for food demand • Optimization of all water uses including the water involved in the rainfed agriculture production «Green Water», and in the international trade exchange «Virtual Water»,
Conclusions • The development of irrigation sector is limited by the availability of water: irrigated agriculture is increasing its efficiency and promoting better use of water. • The potential of “Green Water” is large. Its development requires the implementation of a coherent strategy to promote the sector of rainfed agriculture, vulnerable to rainfall variability: • 1. Development of technical tools for better assessment of the Green Water resource in order to make it more visible: identification, mapping, etc. • 2. Establishment of regulatory and legislative measures: encourage soil water resources developments, promote foodstuffs storage, implementation of drought insurance mechanisms… • 3. Analysis of the market conditions and prices for specific products (Edible oils, cereals ...) • But first, explain and convince …