Download
1 / 51
510 likes | 634 Vues
Successful Performance Measures How Can We Achieve Them?. Smith Travel Research. * Hotel Industry Performance Tracking - STAR. - Occupancy. - Average Rate. - Revenue Per Available Room. - Market Share. * Competitive Benchmarking. STR Segmentation. 177 U.S. Markets. - MSA//County.

E N D
Successful Performance Measures How Can We Achieve Them?
Smith Travel Research * Hotel Industry Performance Tracking - STAR - Occupancy - Average Rate - Revenue Per Available Room - Market Share * Competitive Benchmarking
STR Segmentation 177 U.S. Markets - MSA//County 573 U.S. Tracts - Zip Code/County
Successful Performance Measures Rich Carollo, Director Research, CCTB
IACVB Foundation Research Committee • Established in 1999 • 1999 Information Needs Assessment Survey • 1999 Software Survey • 1999 Visitor Profile Project • 2000 Compensation Survey • 2001 CVB Organization and Financial Profile • Convention Income Survey Methodology • 2001 Research Activities Survey
Needs Assessment Survey Visitor Counts STANDARDIZATION Economic Impact Accountability Conversion Rate
Standardization Challenges • Visitor/Delegate Counts • 50, 100 mile or other definition? • City, County, DMA or other? • Impact/Expenditures • Model type? • Avg. Spending • Method • Attendance x exp. • Peak x avg. stay x exp. • Attendance(day and night) x exp. Exhibitors x exp. • Performance Measures (Sales Divisions ROI)
Successful Performance MeasuresKerri KapichVP MarketingSan Diego CVB IACVB Annual Convention July 17, 2001
San Diego Convention& Visitors Bureau • Founded in 1954 • Mission • To ensure success of San Diego’s convention and visitor industry for the benefit of the greater San Diego community and its visitors • Total operating budget = $16.2 million • 89% funded by Local Government • 11% funded by Members and Other
Tourism Infrastructure • 460 Hotel/Motels - 108 convention/conference • Over 6,500 Restaurants • San Diego Convention Center Corporation • 4 Major Attractions - Sea World, San Diego Zoo, Wild Animal Park, LEGOLAND • 92 Golf courses • Rich arts and culture scene - 90 museums/historic sites and monuments, 125 performing arts organizations, over 300 festivals and events
San Diego Tourism • $5.2 billion economic impact • 26.5 million visitors annually • 15.1 million overnight • Primarily Leisure Destination • 85% Leisure • 8% Meetings/Conventions • 5% Commercial/Business
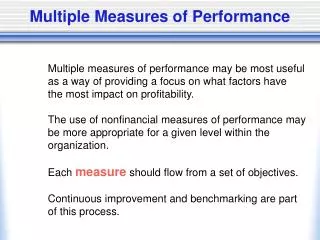
Performance MeasuresThe Challenges • Multitude of Stakeholders = Multitude of Measurements • What’s in it for me? • Local government differs from members’ needs • Lack of Industry Standards • terminology • methodology • Not selling widgets
Where We Are • Invest in Research • 6% of budget allocated to department and contracts • foundation for strategic planning • essential to measure success • Audit of all reporting systems • Building a better tomorrow
Key Performance Measures • Visitor Industry Statistics • Health of industry • Program Analysis • Measure effectiveness of specific campaigns • Market Share • Marketing Return on Investment
Industry Performance • Overnight Visitors • Visitor Spending • Hotel Room Nights • Hotel Occupancy Rate • Hotel ADR • Airport Arrivals • Attraction Attendance • Convention/Meeting Attendance
Program Effectiveness • Sales Measurements • Leads • Room Nights • Advertising Measurements • Pre- and post-awareness studies • Image perception studies • Conversion studies - inquiries • Market Reports • Market share and competitive set
Return on Investment • Partnered with the State of California • Hired D.K.Shifflet • year-long study assessing total marketing impact on the leisure travel market • measured those who inquired and those who don’t • determined awareness, attitudes, interest and intent shifts caused by marketing programs
ROI Study - Key Findings • Budget issues • Low share of voice - messages are received favorably but difficult to stay top of mind • We move the meter in some markets better than others • Branding is working • Consumer perceptions are changing • Travel experience is delivering on promise
Key Findings cont. • Better origin market analysis data • Valuation tools beyond volume • Avg. Los Angeles Trip Expenditure = $309 • Avg. Denver Trip Expenditure = $1,471 • Insights into consumer motivation and behavior
The Bottom Line • For every $1 we spend on marketing San Diego, we generate $54 in return • In spot markets, we increase our ROI to $77
We’re Not There Yet • There is still a gap • Industry performance and marketing ROI don’t address other stakeholders’ needs • Reporting audit conclusions • Drowning in data • Fragmented • Requires coordination of financial, research, IT, marketing, sales, membership
The Future Vision • Centralized database • Centralized reporting through Research Department • Customized reports and analysis for members, local government and employees • Visitor Relationship Management - maximize ROI
From Beans to Bucks to Clout: Jogging the Winding Path toward Accountability Ed McWilliams, Ph.D.VP Destinations D.K. Shifflet & Associates Ltd “ Setting the Standard”
Beans Versus Budgets Principle 1: More Beans = More Budget ? D.K. Shifflet & Associates Ltd “Setting the Standard”
Counting the Beans • How many sales Leads/calls? • How many convention delegates? • How many delegate room nights? • What are Occupancy Rates? • How many articles written? • How many Column Inches of PR generated? • How many consumer impressions? • How many people converted? D.K. Shifflet & Associates Ltd “ Setting the Standard”
Counting the Bucks • Visitor Spending • Delegate Spending • Room Night Sales • Economic Impact D.K. Shifflet & Associates Ltd ‘Setting the Standard”
Accountability = Connecting the Dots Cause versus Effect Programs versus Impacts Return versus Investment D.K. Shifflet & Associates Ltd “Setting the Standard”
Performance Based Budgeting • Goals • Objectives = Budget $ , FTEs • Strategies Linking Activities, Beans and Bucks D.K. Shifflet & Associates Ltd “Setting the Standard”
Program Measures:A few Definitions Input -> Output -> Outcome -> Impact -> Efficiency D.K. Shifflet & Associates Ltd “Setting the Standard”
Program Measures:A few Definitions Input Measures: Budget and Staff Output Measures: Program/staff Activity. For example: # of sales calls, # of consumer impressions generated, # of inquiries fulfilled. D.K. Shifflet & Associates Ltd “Setting the Standard”
Program Measures:A few Definitions Outcome Measures: Measures the results from programs. For example: Room Nights generated by convention delegates, travelers generated in response to advertising, etc. D.K. Shifflet & Associates Ltd “Setting the Standard”
Program Measures:A few Definitions Impact Measures: Translation of program results (outcomes) into Bucks, or other tangible measures. e.g. Total Spending by Visitors Influenced by Advertising, $ value of Convention Room Nights sold, Total Spending of Convention Delegates D.K. Shifflet & Associates Ltd “Setting the Standard”
Program Measures:A few Definitions BEANS=“Activity Stuff” Input $ -> BEANS= “Outcome Stuff” Impacts $ -> D.K. Shifflet & Associates Ltd “Setting the Standard”
Program Measures:A few Definitions Efficiency Measures: Estimate cost per unit generated by a program. For Example. • Cost per consumer inquiry, • cost per consumer converted, • cost per convention delegate, D.K. Shifflet & Associates Ltd “Setting the Standard”
Program Measures:A few Definitions Ultimate Efficiency Measure: Return on Investment • ROI: dollars returned per dollar invested • Ideal to measure each program (allows like comparisons across programs). D.K. Shifflet & Associates Ltd “Setting the Standard”
Common Accountability Research: Conversion Study Strengths: Ideal for consumer Marketing budgets under $1 million. • Measure differences across target markets. Aides marketing/media decisions. • Good overall consumer marketing accountability Limitations: • Miss those who saw or heard Ads and traveled, but never inquired • Usually a small percentage of actual visitors • Often not measured for specific markets D.K. Shifflet & Associates Ltd “Setting the Standard”
Audience Penetration Audience – 100% Aware - 24% Confirmed Aware 13% Traveled – 3% Influenced – 2% Inquired - 1% D.K. Shifflet & Associates Ltd “Setting the Standard”
TravelerPenetration Travelers – 100% Aware – 62% Confirmed Aware 50% Influenced – 34% Inquired – 11% D.K. Shifflet & Associates Ltd “Setting the Standard”
Using Efficiency Measuresfor Mgmt Decisions: Conversion Rate 42% Cost Per Conversion= #of travelers/ Budget$ For Example: $12 Market A: CPC= $10 Market B: CPC= S 8 Market C: CPC= $15 D.K. Shifflet & Associates Ltd “Setting the Standard”
Using Efficiency Measuresfor Mgmt Decisions: Advertising Example 1: Market A: CPC= $10 ROI = $ 25 Market B: CPC= $ 8 ROI = $ 10. Market C: CPC= $15 ROI = $ 35. D.K. Shifflet & Associates Ltd “Setting the Standard”
Using Efficiency Measuresfor Mgmt Decisions: ProgramOutputOutcomeImpacts ROI Budget Convention Sales Sales Leads # Room Nights $ Value of Delegates Impact/Budget D.K. Shifflet & Associates Ltd “Setting the Standard”
Cost per Visitor by Market D.K. Shifflet & Associates Ltd “Setting the Standard”
Marketing Return on Investment by Market D.K. Shifflet & Associates Ltd “Setting the Standard”
DKS&A “Advertising Impact Monitor”Answers Your Fundamental Advertising Questions • How is consumer awareness, interest, intent, and travel behavior changing in response to advertising? • What is the ROI of TV advertising in spot markets? • Is television worth the premium over print? 4. How much does it cost to draw a customer from Market A versus Market B? 5. What is the Return on Investment for Market A versus Market B? D.K. Shifflet & Associates Ltd “Setting the Standard”
Measurement Strategies and Costs Golden Rules: 1) Leverage accountability costs into Investments for strategic information. 2) Always invest research $ in proportion to your spending. Big programs deserve more research. 3) Be brutally honest. Remember all goals are not quantifiable. 4) Be prepared to change. D.K. Shifflet & Associates Ltd “Setting the Standard”
Measurement Strategies Next Steps: • IACVB – Set agenda to Establish Industry Definitions • IACVB – Develop standard accountability prinicpals • IACVB: Publish, promote, educate & advocate for use of standards. D.K. Shifflet & Associates Ltd “Setting the Standard”
From Beans to Bucks to Clout: Jogging the Winding Path toward Accountability D.K. Shifflet & Associates Ltd “Setting the Standard”