Evaluating Fish Biomass Dynamics in the Everglades using the ALFISH Model
The ALFISH model serves as a critical tool for understanding fish biomass dynamics within the Everglades ecosystem. This spatially explicit simulation model helps assess the impact of fluctuating water management scenarios on the distribution of food resources essential for apex consumers like wading birds. The model evaluates the interactions between large and small fish populations, generating maps and statistical outputs that indicate fish density variations over time, particularly during key breeding seasons. Results will inform and enhance water management strategies.

Evaluating Fish Biomass Dynamics in the Everglades using the ALFISH Model
E N D
Presentation Transcript
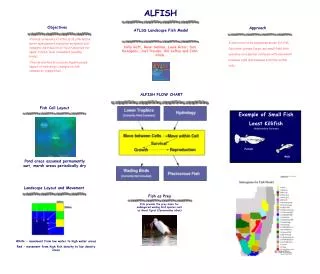
ALFISH ATLSS Fish Functional Group DynamicsModel Holly Gaff, Rene’ Salinas, Louis Gross, Don DeAngelis, Joel Trexler, Bill Loftus and John Chick
ALFISH Fish biomass is one of the most important components of the Everglades system. For example, fish provide the prey-base for wading bird species such as Great Egret (Casmerodius albus). To produce projections of fish biomass, ATLSS uses a spatially explicit group dynamic simulation model, ALFISH.
Objectives • Provide estimates of effects of alternative water management scenarios on spatial and temporal distribution of food resources for upper trophic level consumers (wading birds). • Provide method to evaluate hypothesized impact of hydrologic changes on fish functional group dynamics.
Approach A size-structured population model for fish functional groups (large and small fish) that operates with a 5-day time step on a 500x500m spatial cell basis with movement between cells and between habitats within cells.
Fish Cell Layout Pond areas assumed permanently wet, marsh areas periodically dry
Landscape Layout and Movement White - movement from low water to high water areas Red - movement from high fish density to low density areas
ALFISH Restudy Output • Maps of the Small Fish functional group total number density (#fish/m2) in the marsh areas within cells over the entire region modeled at a 500 m x 500 m cell resolution generated for a single day at different days of the year. This allows comparisons for years with a high, average, and low level of rainfall
ALFISH Restudy Output • Maps generated for a single day at several times during wading bird breeding season in cells with appropriate water depth for wading bird foraging). Again, these allow comparisons of fish availability to wading birds for years with a high, average, and low level of rainfall.
ALFISH Restudy Output • Graphs of average Small Fish functional group total number density (# fish/ m2) in the marsh areas within cells over the entire 31 year scenario for particular days of the year. • Graphs of average Small Fish functional group total number density of fish of certain sizes in certain water depths.
ALFISH Evaluation • A start on evaluating the fish landscape model, ALFISH, has been made, using data from Shark Slough and WCA3 - 16 sites for 1995 and one site for 1986-1995. • This has so far involved • Comparisons of output statistics (fish densities) of three alternative models with empirical data • Correlation analysis of model and fish density data
WCA 2A 9 10 6 5 3 WCA 3A 8 2 4 1 7 WCA 3B 50 23 6 Shark River Slough 7 8 37 Everglades National Park 20 km Data Sites
Evaluation of fish functional group dynamics model • Three models, with different assumptions concerning “density of ponds” and “consumption” parameters, were compared with both the long time series from the single site and the spatially explicit sites for 1995. • Model 1 – original Restudy parameters • Model 1.1 – increased number of ponds • Model 2.5 – increased consumption of prey
Results of ALFISH Evaluation WCA 3A
Results of ALFISH Evaluation Shark River Slough
Results of ALFISH Evaluation Correlation analysis shows that ALFISH explains only 25-35% of the field data when comparing data from different spatial sites and years. But this is consistent with the available fish data showing that hydrologic differences account for only 20-40% of the variation in fish densities (Chick 1998).
Results of ALFISH Evaluation Shark River Slough Site 6
Conclusions • Continued improvements as new data becomes available • Currently being used to test different hypotheses • Will be linked to lower trophic level model