
The Coded-Wire Tag Program: Regional Overview
The Coded-Wire Tag Program: Regional Overview. Coded Wire Tags: Tiny Tool for Stock Identification. Stainless steel micro-tag Introduced in late 1960s Replaced fin clips for stock id Placed in nasal cartilage Originally binary coding scheme

The Coded-Wire Tag Program: Regional Overview
E N D
Presentation Transcript
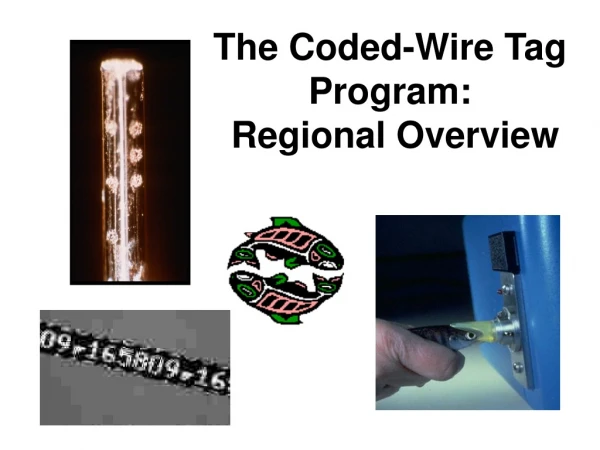
Coded Wire Tags: Tiny Tool for Stock Identification • Stainless steel micro-tag • Introduced in late 1960s • Replaced fin clips for stock id • Placed in nasal cartilage • Originally binary coding scheme • Adipose clip used ~ 3 decades as external flag for tagged fish • Present: Use of electronic detection: Ad clip now flag for hatchery fish
Major Advantages of CWTs • Small size (0.25 x 1.1 mm) • Ease of application • Very low tag loss • Vast number of codes • Low cost (14 cents/tag applied) • Biological compatibility • Very minimal impact on survival
CWT Quality Today • Tag 16/58/09 made 11 April 2002
Types of CWT Marking Studies 1) Management Objectives • Stock contribution (fisheries viewpoint); Harvest allocation; Survival trends; Escapement 2) Hatchery and Wildstock Evaluation • Stock contribution to the various fisheries coastwide; Straying; Age composition, etc. 3) Experimental Comparisons • Diets, release sites, time of release, density, etc 4) Habitat Evaluation
Relevance of CWT Information to the NWPPC’s Fish & Wildlife Program • The CWT is the stock ID tool used coastwide for evaluating survival rates and status of salmonid stocks. • It serves a wide variety of F&W Program purposes, including: • Hatchery monitoring and evaluation • Adult and juvenile migration patterns • Evaluate and monitor harvest • Coastwide harvest management closely intertwined with the mission of the F&W Program; and is critical to protecting Columbia River stocks in trouble. • Federal ESA depends on CWT marked hatchery fish as indicators for wild listed stocks.
Tagging Crew at work removing adipose fin and inserting CWT into the snouts of smolts
NMT’s ‘AutoFish System’ Marking Trailers, with Fish Guidance Trays
Volitional Entry of Juvenile Fish into the Auto Clipping and Marking System
Scale of Coastwide CWT Tagging Program • 50 million tagged smolts released coastwide each year at a cost of ~$7.5 million • Over 1,200 new codes involving hundreds of studies • Chinook tagging levels are highest at 39 million; Coho levels at 9-10 million • 54 federal, state and tribal fisheries agencies plus private entities now tag fish
Principal Tagging Facilities • Tagging programs are carried out at over 330 federal, state, tribal, and private hatcheries and rearing facilities on the west coast, including Canada • Wild stocks also captured and tagged at numerous sites
Washington’s Coastal and Columbia River Hatcheries(excluding southern Puget Sound)
Scale of CWT Tagging Programin the Columbia Basin • 18-20 million of the 50 million chinook and coho tagged annually come from the Columbia Basin • Of those, ~6-7 million tags were directly funded by BPA in 2003 • On a coastwide basis, BPA funds an estimated 13% of the 50 million tags released annually
BPA Funded CWT Tagging Programs in the Columbia Basin • Prior to 1989, many hatcheries released chinook and coho without tagged groups • In 1989 BPA began to fund tagging the “Missing Production” groups at ODFW, WDFW and USFWS hatcheries • In 2000, projects renamed “Annual Stock Assessment - CWT” to avoid former confusing name
CWT Recovery ProgramBPA Project 198201301 • Ongoing data collection/management program • Five component projects: ODFW, WDFW, PSMFC • Tag Recovery Sampling Programs • Columbia Basin sport and commercial fisheries jointly sampled by ODFW and WDFW • Buoy 10 to Priest Rapids Dam (397 miles) • Oregon ocean fisheries (commercial and sport) by ODFW (~1/4 cost of sampling funded by BPA) • Tag Extraction: ODFW’s Clackamas Tag Recovery Lab • Data management: PSMFC’s Mark Center • Combined 2005 Funding Level: $2,028,757
Oregon Ports and Ocean Management Areas for Salmon Fisheries
Columbia River Commercial Catch Flowchart for Columbia River CWT Recovery Programs CWT Sampling (ODFW, WDFW, USFWS, NMFS) ODFW Fish Tickets WDFW Fish Tickets Snouts Taken Sampling Data ODFW Biometrics Section Data Processing & Validation ODFW Head Lab Regional Mark Processing Center Other Agencies
ODFW Tag Recovery LabClackamas, Oregon • Extract and decode CWTs from fish heads recovered in the sampled fisheries, etc. • Verify and report CWT tag data to ODFW’s data management and to PSMFC’s Regional Mark Information System (RMIS)
Number of Heads Processed by ODFW’s Tag Recovery Lab during 2003 -2005
Sampled Heads Brought into the Lab in Frozen and/or Formaldehye Soaked
Ongoing Challenges for the Clackamas Tag Recovery Lab • The processed heads represent samples taken from fisheries, spawning grounds, and hatchery rack returns over multiple years (e.g. 2005 work covered 2002-2005 samples) • Level funding, staff reductions and large escapements have overwhelmed the capacity of the lab to keep abreast of the work. • This has forced prioritizing CWT processing: • In-season management needs met first • Fishery evaluation needs met second • Hatchery returns typically met last unless specific needs exist
The Regional Mark Information System (RMIS) • CWT data are forwarded to the Mark Center where it is loaded and validated against an extensive set of checks • Once validated, the data are moved into an online relational database (Oracle) that the public can access by Internet • Data is accessible in either PSC exchange format, or various summary reports
Data Flowchart for the RMPC REGIONAL MARK PROCESSING CENTER R M I S COAST - WIDE DATA USERS Errors VALIDATION PROCESS PSC format raw data Release Recovery Catch/sample Location codes Data description RMIS Reports: Detail Summary Ad - hoc ALL COAST - WIDE TAGGING & RECOVERY AGENCIES RMPC validated data REGIONAL MARK INFORMATION SYSTEM (R M I S) PSC format valid data C A N A D A


