Download
1 / 22
220 likes | 472 Vues
Being a binding site: Characterizing Residue-Composition of Binding Sites on Proteins. joint work with Zolt á n Szabadka and G á bor Iv á n, Protein Information Technology Group Department of Computer Science, E ö tv ö s University Budapest, Hungary. Vince Grolmusz. The Protein Data Bank.

E N D
Being a binding site: Characterizing Residue-Composition of Binding Sites on Proteins joint work with Zoltán Szabadka and Gábor Iván, Protein Information Technology Group Department of Computer Science, Eötvös University Budapest, Hungary Vince Grolmusz
The Protein Data Bank • It is a collection of the experimentally determined 3D structures of biopolymers and their complexes, today it contains more than 45 ,000 entries • Experimental methods include • X-Ray Diffraction • Nuclear magnetic resonance (NMR) spectroscopy • PDB file formats • pdb format • mmCIF format • XML format
The graph model of molecules • The molecule is modelled with a graph where the vertices are the atoms and the edges are the covalent bonds • Each atom has an atomic number and a formal charge • Each bond has an order that can be • 0 for coordinated covalent bonds • 1,2 or 3 for single, double and triple bonds respectively • Aromatic ring systems are modelled with alternating single and double bonds • A steric model is a graph model plus 3D coordinates for the atoms
Main problems • Given a pdb file, find the steric model of each molecule in it • Find the molecules which have unrealistic steric models • Make a searchable database of different protein-ligand complexes which fulfil certain additional quality requirements Our solution: The RS-PDB Database (RS stands for Rich-Structure)
Difficulties and solutions • The two main difficulties with these problems • the basic units of a pdb entry are the residues and HET groups, and not the molecules • there are atoms, whose coordinates could not be determined, and these are simply missingfrom the files • Therefore the problem can not be solved for every entries • We developed a method to automatically process the PDB mmCIF files and created a database with an approximate solution and marked the places, where there are errors or ambiguities
HET Group Dictionary • The basic units of a pdb entry are the residues and HET groups, these will be called monomers • A monomer can be a molecule or a molecule fragment • Each monomer has a unique code: ASN, C, MG, NAD, … • The covalent structure of these monomers are in a separate part of the PDB, the “PDB Chemical Component Dictionary'‘, formerly called the HET Group Dictionary (HGD) • We converted the structure descriptions of these monomers to the graph model and put them in our HGD database
Processing of an mmCIF file (1) Polymers • We read all the so called entities from the file, each of them containing one ore more monomers • Each entity has a type, that can be polymer, non-polymer or water, and each polymer entity has a polymer type • Next we build the polymers from the monomers, one-by-one, for example in the case of proteins:
A O O R R HXT HXT HA HA H H N N HN2 HN2 CA CA OXT OXT ... C C C C OXT OXT CA CA HN2 HN2 N N H H HA HA HXT HXT R R O O n 2 n-1 1 A O O R H R HA HA N H N OXT ... CA C C CA CA C C CA N HN2 N HA HXT R HA H R O H n n-1 O 2 1 Constructing Polypeptide chains – the peptide bond When a new amino acid (i.e., a monomer) is added we remove the atoms OXT and HXT from the end of the chain, and the atom HN2 from the new monomer, and add a covalent bond between the atoms C and N. In the case of amino acid PRO, we remove both HT1 and HT2; if, in the case of a non-standard amino acid (i.e., protein monomer), the above mentioned atoms are not present, we refuse to make chain.
After the polymers are built, we define three types of polymer molecules • Polypeptide chains (P) : >10 monomers long • DNA/RNA chains (N) : >5 monomers long • Polysaccharides (S) : >5 monomers long • The sequence of these polymers will give the graph model of the molecules
Processing of an mmCIF file (2)Ligands and their bond graph • Initially all monomers not belonging to a polymer are distinct ligands, their graph model taken from the HGD • We read all the available atomic coordinates from the mmCIF file to create the (partial) steric models • We find all pairs of atoms with distance less then 6 Å, building a kd-tree for this purpose • If two atoms from different molecules are within covalent distance, we try to combine their graphs • If this fails, or the atoms are too close, we record this in a separate database table containing bond errors • Next, crystallization artefacts and “junk” ligands are removed (Similarly as in the PDBBind database).
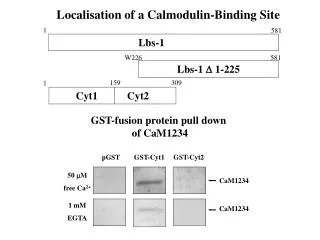
Database of protein-ligand complexes and binding sites • A protein-ligand complex consists of a ligand and one or more protein chains that have atoms in van der Waals distance from the ligand; these atoms are painted red in the figure:
Getting rid of redundancies • PDB is strongly biased in the direction of “popular” or “important” proteins; some chains (e.g., bovine trypsin) are present in more than 100 PDB entries. • When mapping binding sites in the PDB, redundancies must be dealt with; • If to the chain A ligand X is bound to the same place in different PDB id’s -> counted once; • If to the chain A ligand X is bound at distinct places -> counted twice or more • Result: 25,000 binding sites -> 19,000 B.S.
Residues in binding sites • Next, those residues are collected from • protein chains, that are close to the ligands: • We go through the ligand atoms one- • by-one and find those protein atoms • which were closer to them than 1.05 • times the sum of the Van der Waals radii • of the two atoms scanned; • We do not have covalently bound ligands; they were already filtered out . • Next we identify the residues containing these atoms: for every • binding site a subset of the 20 amino acids were created. • If the same residue appeared more than once, we inserted • it only once into the residue-set: we are interested in the plain • appearance of the residue at the binding site.
Association rules in residue-sets • We are interested in implication-like rules such as: (ALA,LEU) (ILE,VAL) that is, if a binding site contains amino acids leucine and alanine, it will ``likely'' contain also valine and isoleucine. • Main attributes of the rules are: support: Prob(ALA,LEU,ILE,VAL) confidence: Prob((ILE,VAL) | (ALA,LEU)) lift: Prob(ALA,LEU,ILE,VAL)/(Prob(ILE,VAL)Prob(ALA,LEU))
What is interesting? • Association rules X Y, where Y is a very frequently appearing residue-subset, are not interesting generally. • On the other hand, if Y is infrequent, then the support and the confidence generally will not reach the thresholds to be included in our results. • For example, Y=GLY appears very frequently, while Y=CYS or Y=TRP appears rarely. • Association rules of unusually high and unusually low lifts and rules of form X Y with high confidence and not-too-high support for Y are of particular interest. Our next figures here visualize such remarkable data.
Our first figure… …was created by deleting all X GLY association rules for clarity, and including only those rules which satisfy that • their support is at least 7.15% and • their confidence is at least 0.5 and • at least one of the following conditions hold: • a) their confidence is at least 0.8 or • b) their lift is at least 1.8 or • c) their lift is at most 0.97 or • d) their support is at least 24%.
Low-lift area High-confidence area High-support area High-lift area
Figure 2 contains rules, where… • all X GLY association rules are deleted for clarity, and • the support is at least 7.15% and • the confidence is at least 0.55 and • the lift is at least 1.7.
Here, ALA, the sixth most frequent residue, is present in almost all bases; and THR (threonine), the tenth most frequent residue appears in the center; all bases have 3 or 4 elements. All large fan-in stars contains GLY
Conclusions • We believe that by the analysis of the residue-composition of the binding sites in a really large and reliable data set, one can identify pretty interesting data patterns, applicable in inhibitor and drug design; • We think that this work is just one of the first steps in that direction.