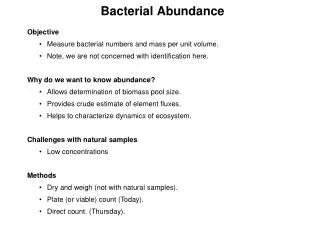
Bacterial Abundance
Bacterial Abundance. Objective Measure bacterial numbers and mass per unit volume. Note, we are not concerned with identification here. Why do we want to know abundance? Allows determination of biomass pool size. Provides crude estimate of element fluxes.

Bacterial Abundance
E N D
Presentation Transcript
Bacterial Abundance • Objective • Measure bacterial numbers and mass per unit volume. • Note, we are not concerned with identification here. • Why do we want to know abundance? • Allows determination of biomass pool size. • Provides crude estimate of element fluxes. • Helps to characterize dynamics of ecosystem. • Challenges with natural samples • Low concentrations • Methods • Dry and weigh (not with natural samples). • Plate (or viable) count (Today). • Direct count. (Thursday).
27 Gt C oceans-1 U G B B CO2 Why do we want to measure bacterial concentration? E.g., Bacterial concentration is 100 cells ml-1 or 100 fg C ml-1 • Estimate bacterial pool size • Ocean: 109 cells l-1 • 20 fg C cell-1 (20 10-15 g C cell-1) • 1.37 1021 l oceans-1 • Crude estimate of element fluxes (x: bacterial biomass) • Growth rate: G = x; : specific growth rate • Uptake rate: U = x/; : growth efficiency • Typical: = 1 d-1; = 0.2 • Ecosystem dynamics R Conc. Time
Cell density OD How is bacterial concentration measured? • Laboratory cultures • Measure optical density and cell dry weight • Problems • High cell densities required. • Must be only cells (i.e., no debris or detritus) • High predator abundance would also skew results. • Technique does not work in the field! • Dilution Plates • Grow single cells on Petri plate until colonies are visible, then count colonies. • Must use serial dilution so that colonies are in countable range. • This method has a major problem. What is it? (Akin to growing fish in chicken soup) • Direct Counts • Use microscope to directly count bacteria. • Problem: Bacteria in natural environments are very small and difficult to see and distinguish from detritus using standard light microscopy.
1 ml 1 ml 1 ml 1 ml 1 ml 1 ml Dilution Plates 9 ml 10-1 10-2 10-3 10-4 10-5 10-6 Statistically relevant colony density: 30 - 300 Technique largely used for isolation or water testing, such as coliform test.
Dilution Plate Calculations N: Number of colonies on plate VS: Volume pipetted onto Petri plate. D: Dilution factor for test tube plated out. : Concentration of cells in original sample (cells ml-1) Example: N: 33 VS: 100 ml D: 10-4
Fecal Coliform Counts The abundance of fecal coliform bacteria are used as an indicator of fecal contamination of both drinking water and recreational water (i.e., swimming, shellfishing). Fecal coliform bacteria inhabit the intestinal tracks of animals. While the indicator bacteria are typically not pathogens, they indicate that the water has become contaminated with fecal material, either by human or other animals. Although it would be better to assay for pathogens directly (such as hepatitis), it is too difficult to culture these organism quickly and reliably. • Basic method: • Aseptically collect and filter water onto sterile filter. • Place filter on sterile pad that contains medium for the culturing of fecal coliform bacteria (contains eosin-methylene blue dye) • Incubate filter at 37ºC (or higher) • Count colonies to determine colonies/100 ml water • EPA requirements (cfu/100ml): • Drinking water: None • Shell fishing: 14 • Swimming 200
Some Drinking Water Pathogens • Viruses: • Hepatitis • Bacteria: • Cholera (Vibrio cholera) • typhoid fever (Salmonella typhi) • Fecal bacteria (often Escherichia coli) • Protists: • Cryptosporidia • Giardia
Challenges with Direct Count Method • Natural samples contain low concentrations of bacteria (106 cells ml-1) • Must concentrate bacteria • Bacteria are small (0.2 - 1 mm) so difficult to see and differentiate from detritus using microscope with normal or phase contrast lighting techniques. • Must stain with fluorescent dye and use epifluorescence microscopy. Procedure outline • Incubate water sample with fluorescent dye. • Concentrate sample onto 0.2 mm filter. • Place filter on slide, and count bacteria in grid • Calculate bacterial numbers. Direct Bacterial Counts
Epifluorescence Microscopy • Fluorescence • Compound is “excited” at a particular wavelength of light (usually in the UV) • Compound then emits light at a different, lower, wavelength. • Advantage: contrast is extremely high, which allows detection of weak light. • Dyes used • Acridine orange (AO) • DAPI (4’6-diamidino-2-phenylindole) • Mechanisms • AO fluoresces when bound to DNA or RNA. Cells appear orange. • DAPI fluoresces when bound to DNA and is more specific. Cells appear blue.
Epifluorescence Details UV Light source Excitation filter Eyepiece Beam splitter, Emission filter Objective Sample
Slide Preparation for DAPI Drop of immersion oil Cover slip Drop of immersion oil Filter, bacteria side up! Drop of immersion oil Microscope Slide • Notes: • Place filter so that bacteria are on the top side. • Use small drops of immersion oil • Cover slips stick together. If you have more than one, you will not be able to focus well. • Label slide.
Cell Density Calculations • Known or measured • Volume of sample filtered: VS • Area of filter occupied by sample: AF • Area of grid in field of view: AG • Average number of cells grid-1: N • Cell Concentration • Cell Conc: r Whole filter Filter wetted by sample AF = pRF2 RF AG What is the main assumption in this calculation?