
What Is Data Observability
E N D
Presentation Transcript
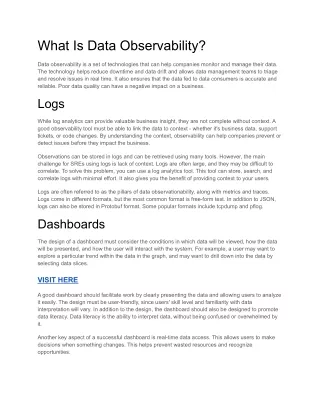
What Is Data Observability? Data observability is a set of technologies that can help companies monitor and manage their data. The technology helps reduce downtime and data drift and allows data management teams to triage and resolve issues in real time. It also ensures that the data fed to data consumers is accurate and reliable. Poor data quality can have a negative impact on a business. Logs While log analytics can provide valuable business insight, they are not complete without context. A good observability tool must be able to link the data to context - whether it's business data, support tickets, or code changes. By understanding the context, observability can help companies prevent or detect issues before they impact the business. Observations can be stored in logs and can be retrieved using many tools. However, the main challenge for SREs using logs is lack of context. Logs are often large, and they may be difficult to correlate. To solve this problem, you can use a log analytics tool. This tool can store, search, and correlate logs with minimal effort. It also gives you the benefit of providing context to your users. Logs are often referred to as the pillars of data observationability, along with metrics and traces. Logs come in different formats, but the most common format is free-form text. In addition to JSON, logs can also be stored in Protobuf format. Some popular formats include tcpdump and pflog. Dashboards The design of a dashboard must consider the conditions in which data will be viewed, how the data will be presented, and how the user will interact with the system. For example, a user may want to explore a particular trend within the data in the graph, and may want to drill down into the data by selecting data slices. VISIT HERE A good dashboard should facilitate work by clearly presenting the data and allowing users to analyze it easily. The design must be user-friendly, since users' skill level and familiarity with data interpretation will vary. In addition to the design, the dashboard should also be designed to promote data literacy. Data literacy is the ability to interpret data, without being confused or overwhelmed by it. Another key aspect of a successful dashboard is real-time data access. This allows users to make decisions when something changes. This helps prevent wasted resources and recognize opportunities.
Column-level profiling Using observability metrics, such as column-level profiling, enables organizations to get a proactive view of data health. This allows them to monitor data pipeline performance and identify potential data issues before they cause business damage. Data observability can also improve security and compliance. The process of data profiling begins with the preparation of source data. Then, you can use a data pipeline to automate the process. The Daton platform can access millions of rows and profile data from a variety of sources. You can then leverage the outputs to diagnose potential issues in data and prevent downtime. The data that you collect and analyze should be in a form that makes sense to you. A good way to do this is to build an observability framework that focuses on dataset and operational monitoring. This will give you a broader perspective on the health of your data platform and help you determine the underlying causes of issues. Monitoring data pipelines Monitoring data pipelines is critical for ensuring they are working properly. Monitoring should be designed to identify significant changes in data and pipeline performance. This should include identifying changes within the pipeline as well as external events that may affect the pipeline. Monitoring should also include reporting on the size and number of input/output files. Metrics can also be used to track intermediate results (the inputs between pipeline tasks). By identifying problems early on, it's possible to fix problems before they cause significant damage to the pipeline. The goal of monitoring data pipelines is to reduce data downtime. This means implementing a proactive data management strategy. This involves identifying issues before they cause costly downtime. This can be done with a variety of methods including data observability. A good data observability solution should also offer an integrated data catalog. A pipeline can be broken into several core components, including origin and destination. Then, it can be further subdivided into the workflow, transformation, and monitoring phases.