1 / 1

Tsutsumi et al., Supplemental Figure 1

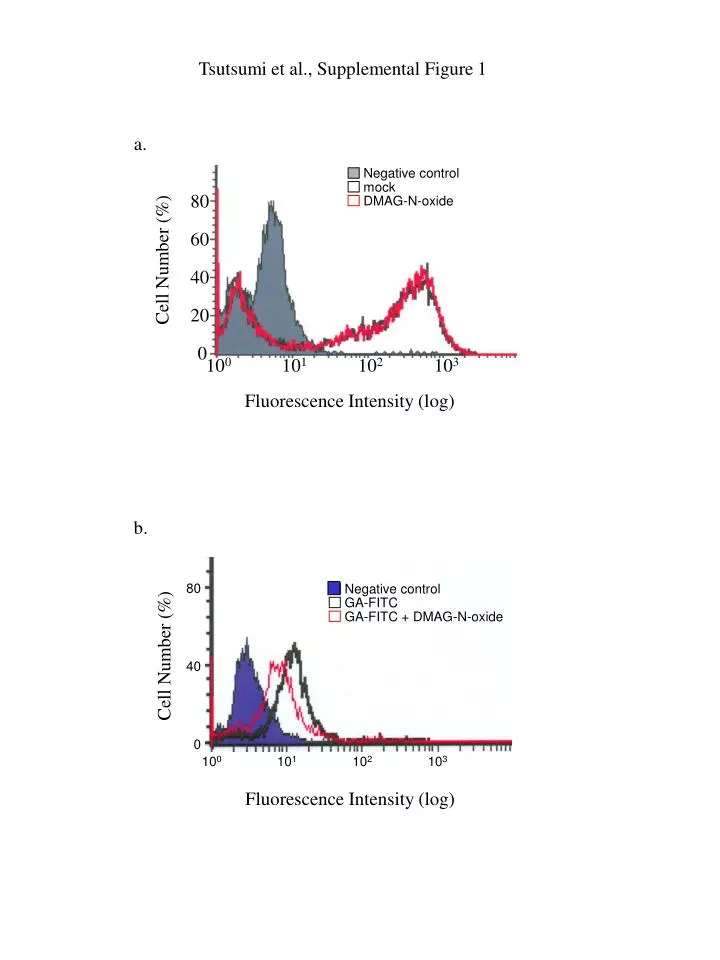
80. 40. 80. 60. 0. 40. 10 0. 10 1. 10 2. 10 3. 20. Negative control. GA-FITC. GA-FITC + DMAG-N-oxide. 0. 10 0. 10 1. 10 2. 10 3. Negative control. mock. DMAG-N-oxide. Tsutsumi et al., Supplemental Figure 1. a. Cell Number (%). Fluorescence Intensity (log). b.

paytah
Télécharger la présentation

Tsutsumi et al., Supplemental Figure 1

An Image/Link below is provided (as is) to download presentation Download Policy: Content on the Website is provided to you AS IS for your information and personal use and may not be sold / licensed / shared on other websites without getting consent from its author. Content is provided to you AS IS for your information and personal use only. Download presentation by click this link. While downloading, if for some reason you are not able to download a presentation, the publisher may have deleted the file from their server. During download, if you can't get a presentation, the file might be deleted by the publisher.

E N D

Presentation Transcript


  1. 80 40 80 60 0 40 100 101 102 103 20 Negative control GA-FITC GA-FITC + DMAG-N-oxide 0 100 101 102 103 Negative control mock DMAG-N-oxide Tsutsumi et al., Supplemental Figure 1 a. Cell Number (%) Fluorescence Intensity (log) b. Cell Number (%) Fluorescence Intensity (log)

More Related