Download
1 / 30
300 likes | 321 Vues
ASSAL-IAIS Training Seminar: Insurance Risks in the Swiss Solvency Test. 22nd November 2012 Alex Summers. Important note. The views expressed in this presentation are the presenter’s own and do not necessarily represent the views of either Zurich Insurance Group (Zurich), or FINMA

E N D
ASSAL-IAIS Training Seminar: Insurance Risks in the Swiss Solvency Test 22nd November 2012 Alex Summers
Important note • The views expressed in this presentation are the presenter’s own and do not necessarily represent the views of either Zurich Insurance Group (Zurich), or FINMA • I am very grateful to colleagues within Zurich and at FINMA for their assistance in preparation • Further information from FINMA on the Swiss Solvency Test can be found on FINMA’s website at http://www.finma.ch
Agenda • Life Insurance Risks framework in the SST • Non-Life Risks framework in the SST • Case study: practicalities of implementing an SST internal model for life risks
Risk based framework for calculating SST Market Consistent Data and Best Estimate Assumptions Mix of predefined and company specific scenarios Standard Models or Internal Models Scenarios Valuation Models Risk Models Market Risk Market Value Assets Credit Risk Life Best Estimate Liabilities P&C Risk margin Health Output of analytical models (Distribution) Aggregation Method Target Capital SST Report Source: FOPI, 2007
Year 0: known Year 1: uncertain Available capital changes due to random events Probability density of the change in available capital Revaluation of liabilities due to new information Available Capital New business during one year Probability < 1% Claims Change in market value of assets Average value of available capital in the 1% “bad” cases = Expected shortfall Catastrophes Market value of assets Best estimate of liabilities Economic balance sheet at t=0 (deterministic) Economic balance sheet at t=1 (stochastic) Risk measure is 99% expected shortfall
Coverage of life risks in the SST Standard Model Expected Shortfall risk calculations • In each case need to consider parameter risk, “random risk”, and accumulations of risk • Alternative decompositions can be considered for Internal Models • Net of reinsurance in line with holistic balance sheet principle • Separate modelling of reinsurance is often needed for assessment of corresponding credit risk • Scenarios allow for separate consideration of catastrophe risk and combinations of risks
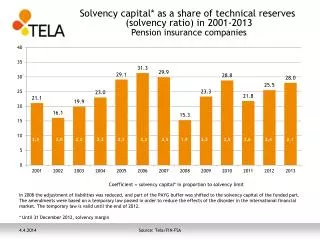
Insurance risk is not typically the dominant risk in SST for Swiss life insurers Source: FINMA SST report 2012
Treatment of life risks in SST standard formula is similar to market risks, but without cross-terms • Individual stresses to available capital for each risk driver • Simplifying assumptions of linear impact, underlying multivariate normal distribution • FINMA supply standard deviation and correlation parameters based on historical analysis • Covariance model for aggregation to overall analytic distribution for insurance risk
Several standard SST scenarios cover extreme life insurance risks • Extreme scenarios include pandemic, terrorism, longevity, lapse • Often a link between different types of risk under a single scenario • Granular treatment • For example, pandemic scenario can incorporate not only an extreme increase to mortality rates, but also falling interest rates, widening credit spreads and generally falling share prices - except for pharmaceuticals
Agenda • Life Insurance Risks framework in the SST • Non-Life Risks framework in the SST • Case study: practicalities of implementing an SST internal model for life risks
Coverage of non-life insurance risks in the SST Standard Model Expected Shortfall risk calculations • In each case need to consider parameter risk, “random risk”, and accumulations of risk • Alternative decompositions can be considered for Internal Models • Net of reinsurance in line with holistic balance sheet principle • Separate modelling of reinsurance is often needed for assessment of corresponding credit risk • Scenarios allow for separate consideration of extreme events such as catastrophe risk, and combinations of risks
Insurance risk is often the dominant risk in SST for Swiss non-life insurers Source: FINMA SST report 2012
Agenda • Life Insurance Risks framework in the SST • Non-Life Risks framework in the SST • Case study: practicalities of implementing an SST internal model for life risks
Models for life risks can be broken down into components • Choice of risk drivers • Risk driver distributions • Choice & parameterisation of distribution • Loss function • Loss in available capital for a given value of the risk driver • Aggregation between losses for different risk drivers
Choice of risk driver needs careful thought • Risks modeled should be relevant to nature of business • Risk drivers can typically be expressed in terms of ratio ACTqx / EXPqx of actual experience over base best estimate expected experience • For example, if best estimate expected mortality rate for a 60 year old EXPq60 is 1%, then under a 1 in 100 stress the rate might be 1.1% • Ratio is then 110%, or a shift of 10% compared to base 100% • This is a helpful simplification to keep the number of risk drivers manageable e.g. allowing for different mortality rates to be applied for different ages
Alternative approaches to decomposition of risks in choice of risk drivers • It’s not always necessary to split • SST standard model starting point is mathematically motivated parameter vs. random fluctuations risk • An alternative split considering sources of impact to available capital can be useful in practice: • 1 year volatility of actual experience impact on policyholder benefits paid • Impact of latest experience through changes to assumption as to future experience over the remaining lifetime of the business
Worked example splitting out components of risk drivers Beginning of the year expectations • Sum at risk USD 1bn • Expected mortality rate 1% Actual experience • Mortality rate 1.1% How this impacts available capital at end of year • Mortality loss of 0.1% x 1bn = USD 1M • New best estimate mortality rate = 1.04% • Suppose impact of changing assumption is to increase BEL by USD 4M • Then total reduction in available capital is 1+4 = USD 5M
Calibrating risk driver distributions seeks to answer several questions • What is the functional form of the distribution? • What are the parameters / key percentiles? • What is the quality of the fit to data i.e. how confident can we be in answers to questions 1 and 2?
Calibrating risk driver distributions is challenging • Calibration is needed for each component of the risk driver • 1 year volatility vs. longer term assumption change risk • Maintenance expense level vs. inflation • Morbidity incidence vs. recovery • Key challenge is finding a sufficient volume of data to give confidence of an appropriate fit • Quality of fit in the tail of the distribution is important • In many cases Normal distribution is natural choice • Asymmetric distributions or distributions with higher kurtosis (fatter tails) could also be considered e.g. lognormal • Standard statistical fitting and validation techniques can be applied e.g. maximum likelihood estimation
Some considerations in treatment of data in calibration of risk driver distributions • Different sources • Population data • Industry data • For insurers, own experience data • Weighting • Amounts vs. lives • Grouping • Underling assumption that observations of the risk driver are independent and identically distributed • Consistency vs. specific local calibration • Important to keep in mind how data will eventually be used
Fitting loss functions • Key questions are choice of fitting points, and functional form • Linear loss function is often good enough • Extensions to higher order polynomials could be considered, particularly for persistency risks • Quadratic, cubic • Extrapolation needs care • More fitting points are needed • Treatment of composite risk drivers can be challenging • Out of sample testing helps give confidence in quality of fit
Using scenarios to allow for combinations of risks simplifies required capital calculations • The simplest approach is to consider loss functions in terms of one risk driver at a time • SST standard model for life insurance risk expected shortfall follows this approach • However this does not allow for the theoretical situation in which losses resulting from stresses to more than one risk factor at the same time differ from the sum of the losses across the standalone stresses • “Cross-terms” in the loss function can allow for this • In many cases, cross-terms are not necessarily material • Combined scenarios as used in the SST can be used • Easier understanding and communication
Combining the loss function with the risk driver distribution gives the marginal loss distribution for each risk driver • In the simple case that the risk driver distribution is Normal, and the loss function is linear, the loss distribution will also be Normal • The same approach applies for more complex risk driver distributions and loss functions, but simulation may be needed in the absence of a straightforward analytical formula
It can be simpler to calibrate the dependency between risk drivers rather than dependency between loss distributions • Correlation matrix approaches help aggregate capital requirements between different risk drivers • Copula approaches can be used to aggregate either marginal loss distributions for different risk drivers into an overall loss distribution, or define dependency structure between underlying risk drivers • It’s not always easy to parameterise a suitable dependency structure between loss amounts • It can be easier to think through the dependency between underlying risk drivers rather than losses
Overview of insurance risks in SST • SST allows a decomposition of required capital into different drivers • Scenarios play a key role in correcting tails of the distribution and aiding communication and understanding of risks • Treatment of life insurance risks in standard model follows a simple approach based on an assumption of linear loss functions, normal distribution of risk drivers and covariance matrix aggregation • Extension of the standard model approach can consider alternative • Choices of risk driver • Risk driver distribution and stress levels • Loss functions • Aggregation techniques
Thank you for your attention Any further questions?
Overview of SST • Risk based • Principles based • Holistic market consistent balance sheet giving economic view of both assets and liabilities • Available capital = market value of assets – best estimate liabilities • Required capital based on risk margin + potential change in available capital over 1 year time horizon, using 1 in 100 expected shortfall as a risk measure, incorporating scenarios • Applies both to legal entities and groups
The SST has established itself as an essential supervisory tool for FINMA • Introduction of SST motivated Swiss insurers to address their solvency situation • Companies took necessary capital increasing and risk reducing measures • Companies improved their risk management • With the SST, FINMA has access to an effective solvency testing instrument • Solvency problems are identified in a timely fashion • Conservative measures can be taken based on a ladder of intervention Source: FINMA 2012
Despite a baptism of fire, the SST has given a clear and helpful view in tough times
The SST Principles in full • All assets and liabilities are valued market consistently • Risks considered are market, credit and insurance risks • Risk-bearing capital is defined as the difference of the market consistent value of assets less the market consistent value of liabilities, plus the market value margin • Target capital is defined as the sum of the Expected Shortfall of change of risk-bearing capital within one year at the 99% confidence level plus the market value margin • The market value margin is approximated by the cost of the present value of future required regulatory capital for the run-off of the portfolio of assets and liabilities • Under the SST, an insurer’s capital adequacy is defined if its target capital is less than its risk bearing capital • The scope of the SST is legal entity and group / conglomerate level domiciled in Switzerland • Scenarios defined by the regulator as well as company specific scenarios have to be evaluated and, if relevant, aggregated within the target capital calculation • All relevant probabilistic states have to be modeled probabilistically • Partial and full internal models can and should be used. If the SST standard model is not applicable, then a partial or full internal model has to be used • The internal model has to be integrated into the core processes within the company • SST Report to supervisor such that a knowledgeable 3rd party can understand the results • Regulatory disclosure of methodology of internal model such that a knowledgeable 3rd party can get a reasonably good impression on methodology and design decisions • Senior Management is responsible for the adherence to principles Defines How-to Defines Output Transparency Governance Source: FOPI, 2007