Unit-VI Satellite Communication Link Design
1.83k likes | 3.98k Vues
Unit-VI Satellite Communication Link Design. R.S.Bhadade MIT-WPU, Pune. Contents (Syllabus, 8 Hrs). Introduction Basic Transmission Theory System Noise Temperature and G/T Ratio Design of Downlinks Satellite Systems using small Earth Stations (ES) Uplink Design

Unit-VI Satellite Communication Link Design
E N D
Presentation Transcript
Unit-VISatellite Communication Link Design R.S.Bhadade MIT-WPU, Pune
Contents (Syllabus, 8 Hrs) • Introduction • Basic Transmission Theory • System Noise Temperature and G/T Ratio • Design of Downlinks • Satellite Systems using small Earth Stations (ES) • Uplink Design • Design of Specified C/N: Combining C/N and C/I values in Satellite Links • System Design Examples
Text Book: Satellite Communications- T Pratt, Charles Bostian, Jeremy Allnutt, John Wiley & Sons. • Reference Book: Satellite Communications- Dennis Roody, McGraw Hill
Introduction • Design of a SCS is a complex process and requiring compromises between many factors to achieve best performance at an acceptable cost. • Three factors influence system design: i. Frequency band ii. Atmospheric propagation effects iii. Multiple access technique
Performance objectives: (in baseband channel) IF Amplifier SNR (analog link) Demodulator C/N C/N BER (digital link) • C/N > 6dB • C/N < 10 dB (digital link)-must use error correction to improve BER calculated at the i/p of receiver ( or o/p port of receiving antenna) • For Noise less receiver :- It is constant at all points (RF and IF chain) • Overall C/N: UL and DL
Antenna Look Angles • For ES antenna alignment, Two Angles need to be adjusted and fixed: • Azimuth Angle • Elevation Angle • Jointly referred as Antenna Look Angles. Azimuth Angle(Φ:- 0 to 2π) Elevation Angle (Θ:- 0 to π)
Earth Station Uplink – ES to a Satellite Downlink – Satellite to an ES
Satellite Functions(RF to RF conversion) 1. Signal reception: Uplink frequency 2. Processing of signal: Amplification, Filtration, and Down conversion, etc 3. Signal retransmission: Downlink frequency
Frequency Bands Most satellites in GEO • C-Band (6/4 GHz) • Ku-Band (14/11 GHz) • Ka-Band (30/20 GHz)
Repeaters and Transponders Bandwidth of Repeater = 500MHz (C-Band: 4200-3700 MHz) Bandwidth of Each Transponder = 36MHz No. of Transponders = 500/36 = 12 Transponders N = (500/7MHz) = 71 TV channels Bandwidth = 1000 MHz (Ku-Band) N= (1000/7) = 142 TV channels OFC:- 30 THz
DTH Antenna Position HPBW
DBS-TV TV Signal link (FTA) TV Rebroadcasting Station- DD-I/II (Sinhagad , Pune ) Down-link Up-link DD National, New Delhi
DBS-TV TV Signal link (Pay) DBS-TV Down-link Up-link Down-link Down-link Up-link DD Kendra, Worli, Mumbai (C-Band) Ku Band (Thodapur, New Delhi)
Basic Transmission Theory • Satellite and Microwave link: Line-of-Sight (LoS) • Link analysis relates the Pt and Pr. • The flux density and link equation can be used to calculate the Pr.
The flux density in the direction of the antenna bore sight at a distance R meters is given by: Pt = Output Power Gt = Transmitting antenna gain Pt Gt = Effective Isotropic Radiated Power or EIRP R= Distance between source and receiving antenna. A = Receiving antenna aperture area (m2) • Aperture efficiency: • Accounts for losses: blockage, phase errors, polarization, and mismatches) • Cassegrain antennas 50 to 75% • Horn : 90 %
Pr = EIRP + Gr – Lp – La – Lta – Lra (dBW) La = attenuation in atmosphere Lta = losses associated with transmitting antenna Lra = losses associated with receiving antenna
Noise Temperature • Noise Temperature: Pn = KTpBn where: k = Boltzmann’s constant (-228.6 dBW/K/Hz) Tp = Physical temperature of source in (kelvin degrees or dBK) Bn = Noise bandwidth (in Hz or dBHz)
NOISE-EQUIVALENT BANDWIDTH • Bn: • Ideal: Infinite (flat PSD) • Receiver (LPF or BPF)
Pno= Noise power at demodulator i/p Grx= Overall ene-to-end gain of the receiver Ts=System noise temperature Pno=kTsBnGrx Pn=KTsBn C/N=PrGrx/KTsBnGrx=Pr/KTsBn Pn= Noise power at receiver i/p C/N at demodulator Pr=signal power at receiver i/p C= Prfor constant envelope signal (FM or PSK)
System Noise Temperature • Superheterodyne receiver (SHR) : • Front end (RF amp, Mixer, and LO) • IF amplifier and filters • Demodulator and Baseband
Pn= GIFkTIFBn+GIFGmkTmBn+GIFGmGRFkBn(TRF+Tin) Ts= [Tin+TRF+Tm/GRF+TIF/GmGRF] Ts= [Tantenna+TLNA]
Noise Figure (NF) • It is frequently used to specify the noise generated within a device. NF = (SNR)in/(SNR)out NF = 1 or 0 dB (Ideal receiver) Td = To (NF-1) Td=Noise temperature To= Reference temp (290 K)
G/T Ratio for ESs • C/N= [PtGtGr/kTsBn][λ/4πR]2 = [PtGt/kBn][Gr/Ts] [λ/4πR]2 C/N α G/T Gr/Ts=G/T Increases Increasing
Design of Downlinks • The design of any satellite communication is based on two objectives: i. Meeting a minimum C/N ratio ii. Carrying the maximum revenue earning traffic at minimum cost. • All satellite links are affected by rain attenuation • C-band:- Effect of rain is small • Ku/Ka-band:- Effect of rain is large • Rain attenuation is a variable phenomenon, both in time and place • Satellite links are designed to achieve reliabilities of 99.5 to 99.99%, averaged over a long period of time.
Link Budgets • It is a tabular method for estimating the Pr and N in a radio link. Also to calculate C/N ratio. • It quantifies link performance • It uses dB units for all quantities. • The link budget must be calculated for an individual transponder, and must be repeated for each of the individual links. • In a 2-way satellite link:- C/N for 4 separate links.
These are usually calculated for a worst case, the one in which the link will have the lowest C/N ratio. • Factors of worst case scenario: • Location of ES at the edge of the satellite coverage zone • Maximum path length (S to ES) • Elevation angle at ES Worst case
ES antennas are assumed to be pointed directly at the satellite, and therefore operate at their on-axis gain. • If the antenna is mispointed, a loss factor is included for reduction in antenna gain.
Link margin: • Clear air: 16.0 - 9.5 = 6.5 dB • In Rain: 12.7 – 9.5 = 3.2 dB Solution: Uplink Power Control (UPC)
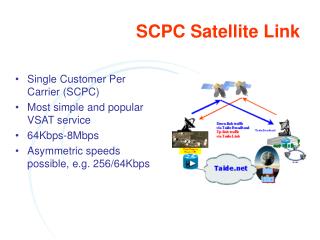
Satellite Systems Using small ESs • Small, low-cost ESs: Satellites carry only one or two telephone or data channels or a DBS -TV signal. • Two parameters in Pr equation: i. Satellite transmitted power ii. Satellite antenna beamwidth (or G)
Ku-Band Receiving Antennas • DTH • (D < 1m) • Transponders are more powerful • VSAT: • (D:1 to 2 m) • Transponders are less powerful
A= Total path attenuation Aca = Clear sky path attenuation Arain= Rain attenuation • A=Aca + Arain dB • Tsky=270×(1-10-A/10) K • TA=ɳc ×Tsky K • Ts rain= TLNA+TA K • ΔNrain=10 log10[Ts rain/Tsca] dB Tsky= Sky noise temperature TA=Antenna noise temperature ɳc= Coupling coefficient (90 to 95%) ΔNrain=Increase in noise power due increase in Ts Tsca= System noise temperature in clear sky conditions
Crain=Cca-Arain dB • (C/N)dnrain = (C/N)dnca - Arain - ΔNrain dB • For Linear (bent pipe) transponder: (C/N)o = (C/N)up + (C/N)dnrain Crain= Carrier power in rain attenuation Cca= Carrier power in clear sky conditions
Uplink Design • Easier than the downlink • Accurate specified carrier power can be presented at the satellite transponder • High power transmitter at ES can be used • Transmitters are costlier than the receivers. • Major growth in satellite communications: Point to multipoint transmission (Cable TV and DBS-TV/Radio)
Nxp= Noise power at transponder i/p Txp= System noise temperature of the transponder • Nxp=k + Txp + Bn dBW • Prxp= Pt + Gt + Gr – Lp - Lup dBW • (C/N)up= 10 log10 (Pr/N) = Prxp - Nxp dB Prxp= Received power at transponder i/p Lp= path loss Lup= all uplink losses
Design of Specified C/N: Combining C/N and C/I values in Satellite Links IF Amplifier SNR (analog link) Demodulator C/N C/N BER (digital link) • Sources of Noise • Thermal noise • For complete satellite link • Receiver it self • Receiving antenna • Sky noise • Satellite transponder • Adjacent satellites • Terrestrial transmitter • Atmospheric gases • Rain
IF Amplifier SNR (analog link) Demodulator • Reciprocal C/N formula (measured in ES@ o/p of IF amplifier) (C/N)o =1/[1/(C/N)1 + 1/(C/N)2 + 1/(C/N) 3 + …] (C/N)o = C/(N1+N2+N3+….) Carrier power is same (C/N)o = C dBW- 10 log10(N1+N2+N3+…. W) dB (C/N)o = (C/N)dn => due to transponder and ES C/N C/N BER (digital link)
Interference: • Intermodulation products (IM) generated by the transponder’s nonlinear i/o characteristic. • IM power level = (C/I) must be include in (C/N)o • Interference from adjacent satellites when small receiving antennas are used (e.g., VSAT and DTH) • Interference cancellation techniques can be used to reduce the level of interference
Overall (C/N)o with uplink and downlink attenuation • Effect of change in (C/N)up on (C/N)o depending on the operating modes (or types) and gain of the transponder • Linear Pout = Pin+ GxpdBW • Nonlinear Pout = Pin+ Gxp– ΔG dBW • Regenerative Pout = constant dBW Pout = Power delivered by transponder HPA to transmitting antenna Pin = Power delivered by receiving antenna to transponder Gxp = gain of transponder ΔG = loss of gain due nonlinear saturation characteristics of transponder
Output backoff • Saturated output power is the maximum output power and is nominal transponder power rating that is usually quoted. • ISI and IM product (FDMA) results- when the transponder operating (non-linear characteristic) close to its saturated output power level. • Transponders are usually operated with output backoff, to make the characteristic more nearly linear. • Typical values of backoff: 1 dB- single FM or PSK carrier (Input backoff: 3dB) 3 dB- FDMA with several carrier (Input backoff: 5dB)
Uplink and Downlink Attenuation in Rain • Rain attenuation affects both uplink and downlink • Rain attenuation is occurring on either uplink or downlink, but not on both at the same time. • Assumption: True for ESs are well separated geographically • Example: PCCOE, Ravet to Balewadi (< 20 km)- Rain attenuation occurs on both links at the same time.