Download
1 / 27
270 likes | 386 Vues
This document covers the fundamental concepts of exponential and logarithmic functions, particularly in the context of biological phenomena. Topics include definitions of exponential functions, logarithms, and allometric relationships, as well as their applications in understanding population growth, radioactive decay, and species-area relationships. The document explains how to transform non-linear data into linear relationships through logarithmic plotting techniques. Correct usage of laws of logarithms and practical examples provide a comprehensive overview for students of mathematical biology.

E N D
Exponentials, logarithms and rescaling of data Math 151 Based upon previous notes by Scott Duke-Sylvester as an adjunct to the Lecture notes posted on the course web page
Definitions • f(x) = ax, exponential function with base a • f(x) = logax, logarithm of x base a • f(x) = axb, is an allometric function
Motivation • Many biological phenomena are non-linear: • Population growth • Relationship between different parts/aspects of an organism (allometric relationships) • The number of species found in a given area (species-area relationships) • Radioactive decay and carbon dating • Many others • Exponentials, logs and allometric functions are useful in understanding these phenomena
Population growth is a classic example • Algae : cell division • Geometric growth 32 64 … 8 16 4 2 1 t = 0 1 2 3 4 5 6
Exponentialsf(x) = ax, a > 0 0 < a < 1 exponential decrease a > 1 exponential increase As x becomes very negative, f(x) gets close to zero As x becomes very positive, f(x) gets close to zero
f(x) = ax is one-to-one. For every x value there is a unique value of f(x). • This implies that f(x) = ax has an inverse. • f-1(x) = logax, logarithm base a of x.
f(x) = ax f(x) = logax
logax is the power to which a must be raised to get x. • y = logax is equivalent to ay = x • f(f-1(x)) = alogax = x, for x > 0 • f-1(f(x)) = logaax = x, for all x. • There are two common forms of the log fn. • a = 10, log10x, commonly written a simply log x • a = e = 2.71828…, logex = ln x, natural log. • logax does not exist for x ≤ 0.
Laws of logarithms • loga(xy) = logax + logay • loga(x/y) = logax - logay • logaxk = k·logax • logaa = 1 • loga1 = 0 • Example 15.7 :
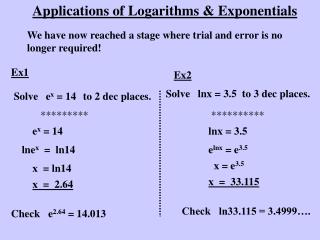
A radioactive material decays according to the law N(t)=5e-0.4t When does N = 1? For what value of t does N = 1? • Example 15.8 : Radioactive decay
To compute logax if your calculator doesn’t have loga or use Example:
general formula for a simple exponential function: • f(x) = x or • y = x • Then • ln(y) = ln x • ln(y) = ln + ln (x ) • ln(y) = ln + x ln • Let b = ln , and m = ln , Y=ln (y) then this shows • Y = b + mx • which is the equation of a straight line. • This is an example of transforming (some) non-linear data so that the transformed data has a linear relationship. An exponential function gives a straight line when you plot the log of y against x (semi-log plot). Special exponential form : f(x) = emx
Consider the algae growth example again. How do you know when a relationship is exponential? Regular plot Semilog plot N= t ln(N) = mt+b
ln(N) = (0.693)t • Fit a line to the transformed data • Estimate the slope and intercept using the least squares method. • Y=mx+b • b~0, m = 0.693.. • Estimate and . • b = ln -> = eb = e0 = 1 • m = ln -> = em = e0.693.. = 2.0 • N = 2t N=2t
Example 17.9 : Wound healing rate Regular plot Semilog plot
How do you make a semilog plot? • Use the semilog(x,y) command in Matlab • Take the log of one column of data and plot the transformed data (here log y) against the untransformed data (here x)
ln(A)=4.96-0.048t • Estimate slope and intercept using least squares • Y = b+mx • m = -0.048 • b = 4.69 • b = ln -> = eb = e4.69 = 108.85 • m = ln -> = em = e-0.048 = 0.953 • A = 108.85(0.953)t A=108.85(0.953)t
f(x)=bxa • Allometric relationships (also called power laws) • Describes many relationships between different aspects of a single organism: • Length and volume • Surface area and volume • Body weight and brain weight • Body weight and blood volume • Typically x > 0, since negative quantities don’t have biological meaning.
a > 1 a < 0 a = 1 a < 1
f(x) = bax f(x) = bxa
Example : It has been determined that for any elephant, surface area of the body can be expressed as an allometric function of trunk length. • For African elephants, a=0.74, and a particular elephant has a surface area of 20 ft2 and a trunk length of 1 ft. • What is the surface area of an elephant with a trunk length of 3.3 ft? • x = trunk length • y= surface area • y = bxa = bx0.74 • 20 = b(1)0.74 20 = b • y=20x0.74 • y=20(3.3)0.74=48.4 ft2
How do you know when your data has an allometric relationship? • Example 17.10
Regular plot log-log plot Semilog plot
How do you make a log-log plot? • Use the loglog(x,y) command in matlab • Take the log of both columns of data and plot the transformed columns.
Y=bxa • ln(y)=ln(bxa) • ln(y) = ln(b) + ln(xa) • ln(y) = ln(b) + a ln(x) • Let • Y = ln(y) • X=ln(x) • B=ln(b) • Then • Y=B + a X • Which is the equation for a straight line. So an allometric function gives a straight line on a loglog plot.