Enhancing Early Childhood Education and Workforce Preparedness in Texas Regions
This report focuses on human capital development and education in various Texas counties, including Brazoria, Fort Bend, and Harris. It highlights significant statistics regarding early childhood care, kindergarten readiness, and K-12 educational metrics. A growing demand for quality education is contrasted with financial constraints and workforce preparedness challenges. Key data points show that only 28.4% of individuals over 25 possess a college degree, revealing potential gaps in future job readiness. The report underscores the critical need for investment in early childhood education and improved teacher quality.

Enhancing Early Childhood Education and Workforce Preparedness in Texas Regions
E N D
Presentation Transcript
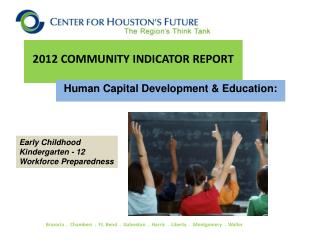
2012 COMMUNITY INDICATOR REPORT Human Capital Development & Education: Early Childhood Kindergarten - 12 Workforce Preparedness Brazoria . Chambers . Ft. Bend . Galveston . Harris . Liberty . Montgomery . Waller
Early Childhood More children in the care of others Where are they? 21.6% care of relatives/friends 23.6% Child Care Center 9.8% Pre K 1.6% Head Start 315,446 Source: U.S. Census Bureau, American Community Survey, 2005-2009 average Brazoria . Chambers . Ft. Bend . Galveston . Harris . Liberty . Montgomery . Waller
Early Childhood Growing demand; less money Source: NIEER State of Preschool Yearbook, 2010 Brazoria . Chambers . Ft. Bend . Galveston . Harris . Liberty . Montgomery . Waller
Early Childhood Teacher Quality, an important metric Brazoria . Chambers . Ft. Bend . Galveston . Harris . Liberty . Montgomery . Waller
K- 12 What our public school students look like Source: TEA. PEIMS Standard Reports, 2011 Brazoria . Chambers . Ft. Bend . Galveston . Harris . Liberty . Montgomery . Waller
K- 12 Third Grade Reading – a critical metric Source: TEA, Children at Risk analysis Brazoria . Chambers . Ft. Bend . Galveston . Harris . Liberty . Montgomery . Waller
K- 12 Algebra I – gateway to higher education International Comparisons Highest score 1,000 US rankings Reading Science Math Average Above Below Average Average 500 502 487 Source: TEA Brazoria . Chambers . Ft. Bend . Galveston . Harris . Liberty . Montgomery . Waller
K- 12 College Bound? SAT & ACT scores flat for 10 years Average All Students SAT – flat at 1000 (1600) ACT - flat at 21 (36) Source: TEA Brazoria . Chambers . Ft. Bend . Galveston . Harris . Liberty . Montgomery . Waller
K- 12 4-year college graduation rates 71% Source: TEA, 2011 Brazoria . Chambers . Ft. Bend . Galveston . Harris . Liberty . Montgomery . Waller
Workforce Preparedness Only 28.4% of people 25+ have a college degree National Average = ~30% Rankings of competitor regions Chicago 14 Philadelphia 16 Dallas 23 Houston 34 Source: H-GAC
Workforce Preparedness First-time college applications, acceptances & enrollments for 4-year universities Source: Texas Higher Education Coordinating Board, 2011 Brazoria . Chambers . Ft. Bend . Galveston . Harris . Liberty . Montgomery . Waller
Workforce Preparedness Rising cost of education Average Annual Cost of Tuition 2011-2012 Community College 4-Year Institution Source: College for All Texans, 2011 Brazoria . Chambers . Ft. Bend . Galveston . Harris . Liberty . Montgomery . Waller
Workforce Preparedness Necessity of post-secondary education Region’s Rank 100 top MSAs Job demand to degrees granted 94th Source: Brookings Institute Source: Georgetown U. Center on Education & Diversity
The Link Between Education & Health Education and Health Impact of parents’ education on child health* *Adapted from Robert Wood Johnson Foundation, 2008 Brazoria . Chambers . Ft. Bend . Galveston . Harris . Liberty . Montgomery . Waller
Morbidity and Mortality vs. Education Education and Health Morbidity & Mortality Brazoria . Chambers . Ft. Bend . Galveston . Harris . Liberty . Montgomery . Waller
Education Pipeline Return on Investment Brazoria . Chambers . Ft. Bend . Galveston . Harris . Liberty . Montgomery . Waller