Download
1 / 35
350 likes | 481 Vues
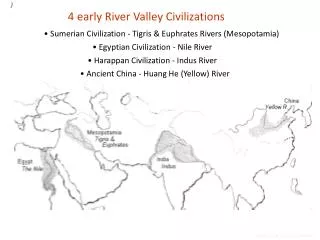
This presentation discusses existing models for the Lower Lakes and Murray River, including 2D RMA and 3D ELCOM simulations. It covers model setup, validation, results, and uncertainties related to virtual and partial weirs. Key objectives are to match observed hydrodynamics, represent key processes, and understand model uncertainties, particularly concerning salinity and water levels. Future prognostic simulations also consider high evaporation rates and border allocation variations until the end of 2010 with visual animations of predicted outcomes, emphasizing the need for ongoing model improvement.

E N D
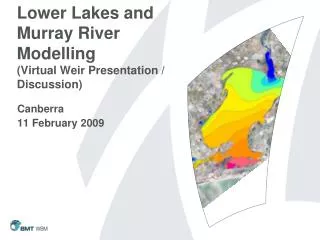
Lower Lakes and Murray River Modelling(Virtual Weir Presentation / Discussion) Canberra 11 February 2009
To be Discussed • Existing Modelling: • RMA (2D) and ELCOM (3D) Modelling of Virtual and Partial Weir Simulations • Model Setup • Model Validation • Model Results & Animations • Model Uncertainty • Empirical Calculations: • Destratification / Richardson Number Calculations • Seiche Volumes
Model Setup/Extents • RMA 2D (Blue) : All areas upstream of Tidal Barrages & Downstream of Lock 1, Lake Albert disconnected • ELCOM 3D (Green) : From Pomanda Island (upstream of weir location) to Murray Bridge • RMA simulation executed first, then results fed to ELCOM (U/S & D/S Boundaries)
Model Validation • Validation period 1/1/2008 – 14/7/2008 • Objectives: • Best match observed hydrodynamics (WL) and salinity • Ensure key processes appropriately represented • Understanding of model uncertainty • Key Uncertainties • Additional salt load along length of River • Additional irrigation demands / groundwater losses?
2 yr “Prognostic Simulations” • Examining what may happen in the future, given continuing high net evaporation (1982) levels, and variations in the South Australia’s border allocation (Border Allocations of 696, 796 and 896 GL/yr), through to the end of 2010. • Simulations aimed at maintaining Lake Level at -1.3mAHD. • Salt water introduced through Goolwa Barrage in October 2009. • Stop logs positioned by-monthly based on water level balance calculation.
Comparison at End 2010 696 GL/yr 796 GL/yr 896 GL/yr
Uncertainty • Model can still be improved • Validation only currently till Mid July 2008 (no destratification period) • No validation data for low level and high salt available • Uses 1 year (2007) wind (cannot predict future wind conditions) • Wind spatially homogenous
Partial Closure Weir Simulations • No Weir • 1100m Gap • 700m Gap • 300m Gap • 100m Gap
Pomanda Island Lake Alexandrina N River Channel Pomanda Embayment Bathymetry