Download
1 / 1
10 likes | 130 Vues
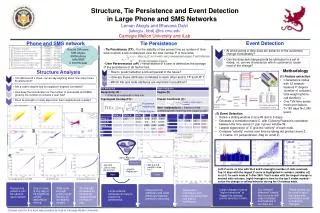
Structure, Tie Persistence and Event Detection in Large Phone and SMS Networks. How to predict whether a link will persist in the future?. Event Detection. Tie Persistence. Phone and SMS network. Tie Persistence. Around 2M users, 50M edges, 500M phone calls/SMS

E N D
Structure, Tie Persistence and Event Detection in Large Phone and SMS Networks • How to predict whether a link will persist in the future? Event Detection Tie Persistence Phone and SMS network Tie Persistence Around 2M users, 50M edges, 500M phone calls/SMS 6 months data • Tie Persistence (TP) : It is the stability of ties across time as number of time-ticks in which a link is observed, over the total number P of time-ticks. • User Perseverance (UP) : Perseverance of a user is defined as the average of the persistence of all his/her ties. • Methodology • Feature extraction: • Characterize nodes with 12 network-features F: degree (number of contacts), total weight (phone call duration), … • One TxN time-series matrix per feature, T=183 days N=1,8M users Structure Analysis • Which link and node attributes are important in prediction? # triads in which node is involved # common neighbours 1 2 Node degree • (2) Event Detection: • Define a sliding window of size W (set to 5 days) • Generate a correlation matrix C, with Cij being Pearson’s correlation between the time series of pair (i,j)over window W. • Largest eigenvector of C give the “activity” of each node. • Compare “activity” vectors over time by taking dot product score Z • (1 if same, 0 if perpendicular –flag for small Z) 3 4 (left) Z score vs time with W=5 and F=inweight (number of calls received). Top 10 days with the largest Z score is highlighted in red bars. (middle) u(t) vs r(t-1) for each node at T=Dec 26th. Top 5 nodes with the largest change is marked with red stars. (right) inweight vs time for the top 5 nodes marked –notice the change in calling behavior during the Christmas week. Tie strength based on (a) # SMS (b) # Phone calls (c) Duration of phone calls Dataset used for this work was provided by iLab at Carnegie Mellon University.