Download
1 / 44
440 likes | 567 Vues
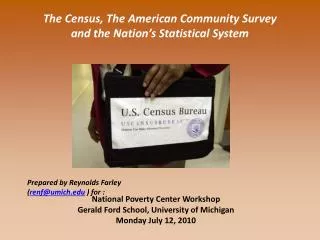
The Census, The American Community Survey and the Nation’s Statistical System. Prepared by Reynolds Farley ( renf@umich.edu ) for :. National Poverty Center Workshop Gerald Ford School, University of Michigan Monday July 12, 2010. Why Does the United States Have the Longest History of

E N D
The Census, The American Community Surveyand the Nation’s Statistical System Prepared by Reynolds Farley (renf@umich.edu ) for : National Poverty Center WorkshopGerald Ford School, University of MichiganMonday July 12, 2010
Why Does the United States Have the Longest History of Continuous Census Enumeration? The framers of the Constitution mandated a decennial census to: • Ensure that population size―not political influence or economic wealth―determined how many representatives each state had in the lower house of Congress • Ensure that federal taxes would be levied upon states in proportion to their population size
The Constitution and the Census • “Representatives and direct Taxes shall be apportioned among the several States which may be included within this Union, according to their respective Numbers, which shall be determined by adding to the whole Number of free Persons, including those bound to Service for a Term of Years, and excluding Indians not taxed, three-fifths of all other Persons. The actual Enumeration shall be made within three Years after the first Meeting of the Congress of the United States, and within every subsequent Term of Ten Years, in such Manner as they shall by Law direct. The Number of Representatives shall not exceed one for every thirty Thousand but each State shall have at Least one Representative. . . “(Article 1, Section 2) Amendment XIV adopted in 1868 allocated representatives according to the whole number of persons excluding Indians not taxed. • “No Capitation, or other direct Tax shall be laid, unless in Proportion to the Census or Enumeration herein before directed to be taken" After the War of 1812, the federal government stopped imposing taxes on states on the basis of their population size. Amendment XVI, adopted in 1913, permitted an income tax.
A Conversation about Race: Is It New or Continuing? Groups specifically mentioned in the Constitution • Free persons • Free persons bound to service for a number of years • Indians not taxed • All other persons; that is, those held in bondage Note: While the term “race” and the phrase “previous condition of servitude” are used in several amendments to the Constitution, the only subsequent mention of a specific racial group in the Constitution is in the 14th amendment adopted in 1868. Indians not taxed were excluded from the census count to be used in allocating seats in the House of Representatives. A 1926 law made Indians residing in the United States citizens, so the concept of Indians not taxed is no longer relevant.
Major National Issues and Controversies in Several Eras of US History: Their Implications for How This Nation Measures Itself From the Revolutionary to the Civil War • Would the United States develop into an economically prosperous, strong nation with a rapidly growing population, or would the American experiment in democracy wither? Recall that in the War of 1812, the British sought unsuccessfully to reestablish their colonial control of the US. Thomas Jefferson strongly urged that the census add questions about manufacturing activities. Some were added beginning in 1820. • Would slavery be tolerated and what rights, if any, did African-Americans have in free states or free blacks in slave states? What would be the status of the large mixed race (black and white) population? The Census, in 1850, began to identify the mulatto population. • Was the United States destined to extend from the Atlantic to the Pacific? If so, how could Indians be removed or confined to undesirable, isolated areas? • Would the United States primarily be governed and populated by Anglo-Saxon Protestants from northern Europe or would immigrants greatly change the United States? A question about place of birth was added to the Census in 1850.
Major National Issues and Controversies in Several Eras of US History Their Implications for How This Nation Measures Itself From the Civil to the First World War • Would the immigration of eastern and southern Europeans, and, potentially many Asians, fundamentally alter the United States in unfavorable ways and ultimately destroy this experiment in democracy? From 1880 through 1910, questions were added to the census to identify the origins of first- and second-generation immigrants, the languages they spoke and their literacy. After the 1880s immigrants from southern and eastern Europe - many Catholics and Jews- were often portrayed as unassimilatable and a threat to the wages of native born workers and the nation’s culture. By 1924, restrictive laws limited immigration from Europe. Efforts to end Asian immigration began in 1870, and by 1890, legal immigration from Asia ended. • Concerns about the control of contagious disease after the Civil War: the rise of the Public Health Movement By the 1870s, those who studied morbidity and mortality realized that most deaths resulted from contagious diseases and that water and sewer systems in urban areas drastically reduced mortality. Supplemental schedules were added to the census beginning in 1880 to measure some conditions of urban life. Questions were also added to the census interview to measure mortality, and beginning in 1890, fertility.
Urbanization and the shift from agriculture to industry Following the Civil War, the nation’s economic base shifted from farming to industrial production, and by 1920, the majority of the population lived in urban areas. Congress asked the census to gather information about cities and about the occupations―but not economic status of adults.
Major National Issues and Controversies in Several Eras of US History: Their Implications For How This Nation Measures Itself From the First World War to the Civil Rights Decade: The 1960s • From the time of President Washington to the present, the federal government played a key role in the economic development of the nation. With industrialization, urbanization and advances in both economics and technology, the role of the federal government in sustaining economic growth became much greater. The Great Depression―from 1929 through 1940―marked a turning point for federal government activities. We now assume that the government’s monetary and fiscal policies can mitigate economic chaos. As a nation, we gradually came to recognize the need for a comprehensive, modern statistical system that would measure economic trends and the human capital of residents.
The Census of 1940―The First Modern Census • For the first time, this census asked questions about: Occupation Industry Class of worker Employment status in some detail Earnings Educational attainment, rather than literacy Geographic migration within the United States • For the first time, the census used a sampling to cut costs and reduce respondent burden, while still obtaining reliable information for small areas.
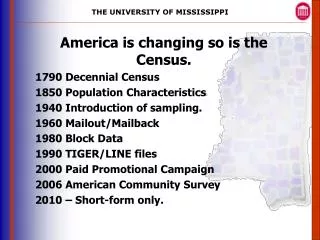
Developments in Census Taking Since World War II • 1940 – Influenced by the economic chaos of the Depression and developments in social science methodology, this was the first “modern” census. For the first time detailed questions were asked about employment, earnings, occupations, industry, class of worker and recent geographic migration. This was the first enumeration to use sampling. • 1950 – Last census to depend exclusively upon enumerators to gather data. • 1960 – Enumeration forms were mailed to all addresses and the householders were told to fill them out. Enumerators picked them up. For the first time, this census used a “short form” including just a few basic questions for all households and a “long form” questionnaire asking many questions of a 20% sample of households. • 1970 – This was the first census to rely upon the mail-out, mail-back procedure. This census used a self-identification procedure for race and, for the first time a separate question sought to identify the Spanish-origin population. The long-form questions asked in this and subsequent censuses were similar to those first asked in 1940. • 1980 – The ancestry question replaced the birthplace of parents questions that had been asked since 1870. The mail-out, mail-back procedure was used and there was increased concern about net census undercount. A Spanish-origin question was asked of all persons for the first time.
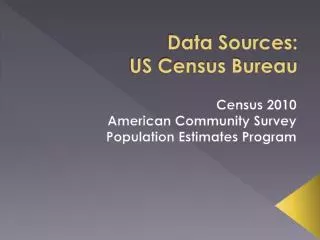
1990 ― Although the census itself included most of the questions asked for a half century, there was immense political controversy about possible adjustments for net census undercount. • 2000 ― There was great controversy how the census would be taken and whether sampling procedures could be used to adjust for net census undercount. • 2010 – The census will ask all householders just six demographic questions: age, sex, Spanish-origin, race, tenure and place of residence. The annual American Community Survey has replaced the long form that had been used from 1960 through 2000 providing much more frequent data about social, economic and demographic trends. The annual American Community Survey is now the source of data previously gathered once a decade on the decennial census “long form.”
The Civil Rights Revolution and the Enhanced Importanceof the Census • Prior to the Civil Rights decade, census results were used primarily to determine how many Congressional seats went to each state. The 1962 Baker v. Carr decision ruled that all elected legislative bodies must represent geographic districts of equal population size. • Developments in demography and in sampling in the 1950s, facilitated the scientific measurement of net census undercount • The Civil Rights Act of 1964 and the Voting Rights Act of 1965 increased the importance of census data for determining the implementation of civil rights programs, including opportunities for minorities to be elected. • Civil rights organizations in the late 1960s and 1970s recognized that net census undercount diminished the political representation of largely African-American areas. • State & Local Assistance Act of 1972 – Revenue sharing on basis of local population count s • Mayors in the 1970s and 1980-both Republicans and Democrats- recognized that net census undercount diminished the political representation of large cities and their fair share of federal revenue. • Because immigrants primarily settle in seven states and because of internal migration to the South and West, two-thirds of the states grew less rapidly than the national average in the 1980s and 1990s, putting them at risk of losing seats in Congress and the Electoral College. Members of Congress from these states often blamed their loss of representation on net census undercount.
Census Undercount, Political Controversy and the Newt Gingrich v. William Clinton Litigation • Developments in demography and in sampling in the 1950s, facilitated the scientific measurement of net census undercount Estimates of Net Census Undercount in Recent Censuses
In February, 1996; President’s Clinton’s Secretary of Commerce, Ron Brown, announced the administration’s plans for Census 2000. To save money and improve quality, it called for sampling both to complete the count and adjust for undercount. • The Republicans, in 1994, won control of the House of Representation for the first time since 1946. Speaker of the House Newt Gingrich feared that the Clinton Administration would contort census counts so as to favor the election of Democrats. He refused to let Congress allocate any funds for a census that used sampling. • U. S. Department of Commerce v. U. S. House of Representatives – the ruling decision for Census 2000 (Decided January 25, 1999) With the Clinton Administration and the Republican Congress stalemated regarding Census 2000, Speaker of the House Gingrich filed a pre-emptive suit against President Clinton seeking a Supreme Court decision that would bar the use of sampling. If there were no sampling, it would be impossible to scientifically adjust census data for net undercount. In a contentious 5 to 4 decision, the Supreme Court ruled against sampling. Justices Scalia and Thomas argued that that since the framers of the Constitution did not mention sampling, they must have intended that the census would be an actual. Justice Breyer argued that the framers intended for the count to be complete using any effective and fair method designated by Congress. Justice O’Connor was the swing vote. She objected to sampling for congressional apportionment.
Legal Decisions Relevant to Census Taking and Apportionment Apportionment Population: The apportionment population is the total resident population (citizens and non-citizens) of the 50 states including U.S. Armed Forces personnel and federal civilian employees stationed outside the United States (and their dependents living with them) that can be allocated, based on administrative records, back to a home state. Apportionment: The process whereby seats in Congress and the Electoral College are assigned to the 50 states on the basis of the April 1 census counts. Redistricting: The process whereby electoral districts within states are assigned to local areas, typically but not necessarily, on the basis of census counts. • All electoral districts within a state or substate area must have nearly identical populations. Baker v. Carr. 369 U. S. 186, 1962 • The 1980 apportionment population need not be adjusted for net census undercount notwithstanding racial differences in completeness of count. Young v. Klutznick, 652 F. 2nd, 617. The court ruled that Detroit lacked standing to sue. • All residents, including non-citizens, must be included in the apportionment population. Federated Americans for Immigration Reform v. Klutznik 79-588, 1980; Ridge v. Verity, 715 F. Supp. Western District, Penn, 1990. In both suits, the federal courts ruled plaintiffs lacked standing to sue.
Montana’s 900,000 residents in 1990 got only one representative in Congress while the average district elsewhere included about 600,000. This was not a constitutional violation. U. S, Department of Commerce v. Montana 504 U. S. 442, 1992 • The apportionment population may include U. S. service personnel and federal government employed overseas whose residence in a state may be established by administrative records. Franklin v. Massachusetts, 505 U. S., 788, 1992 • There was not a constitutional requirement to adjust the Census 1990 apportionment population for net undercount even though undercount rates differed by race, place and age. Wisconsin v. City of New York, 517 U. S. 1, 1996 • Sampling and statistical methods may not be used to adjust the apportionment population for net census undercount. Population counts used for redistricting and other purposes may incorporate adjustments for net undercount. U. S. Department of Commerce v. U. S. House of Representatives, 525 U. S. 316, 1999 • Overseas missionaries whose residence ties to a state may be established by administrative records need not be included in the apportionment population. Utah v. Evans I (2001)
The apportionment population may include people who were not enumerated in the census but who were imputed by Census Bureau procedures. Utah v. Evans II 536 U. S. 452, 2002. By a 5 to 4 decision, the Supreme Court ruled that imputation may be used to minimize census undercount. • Pending litigation. On the basis of Census 2000, the population size of congressional districts varies from 905,000 (Montana) to 495,000 (Wyoming). Census 2010 will likely assign one seat to Montana―population 974,000―but two to Rhode Island― average size 530,000. Is this a constitutional violation of the Baker v. Carr ruling that must be rectified by expanding the size of the House of Representative from 435 to either 932 or 1761? Litigation calling for an increase in the size of the House has been filed in the federal court for the northern district of Mississippi.
Challenges for the 2010 Census Distrust of the Federal Government Economy Hard to Count populations Media Environment
Census Challenges: Economy Housing Vacancies/Foreclosures • Non-response follow up (NRFU) to empty houses increases costs Doubled-up and two residentce families • Everyone needs to understand residence rules Outreach • State sponsorship of Complete Count activities was minimal in many areas due to financial constraints
Hard to Count: Immigrants – mostly Hispanics Rapid growth of undocumented population from 1990 – 2006 • 4% of population; 5.4% of labor force • 76% Hispanic; 11% Asian Varies by state • 1990 (42% in CA); 2008 (22% in CA)
Hard to Count - Hispanics Mistrust/fear and language • Multi-lingual questionnaires and help centers • Won’t solve fear/mistrust issue Hispanic minister calling for boycott to jumpstart immigration reform • Boycott would help states with few Hispanics • Would not be helpful for allocation of federal funds
Good News: Outreach Advertising Campaign • Second census to have a real advertising budget • Look for an ad in the Super Bowl Hard to Count (HTC) campaign • What do you think predicts HTC? * Extensive information was provided to local areas about their hard-to-count census tracts Not “one size fits all” effort • Outreach specialists were recruited for local areas and groups.
Good News for Census 2010 Short Form Census -Ten Questions, Ten Minutes • Long-form questions are part of the American Community Survey (ACS) • This is Leslie Kish’s rolling census Technology Outreach – Stimulus funding allowed for hiring many outreach specialists.
Good News: Technology Second Mailing • First mailing : March 17, 2010. Second mailing in mid-April to census tracts withlow response rates. * Additional mailing of post card to tracts with high proportion of non-English speakers Real-time return data • Can deploy advertising/people to problem areas
Expected and Unexpected Findings for Census 2010- Geographic Issues- *Eight states may gain at least one representative * Nine states may lose one or more representative *The high growth rate and geographic spread of the Spanish-origin population *Relative stabalization of population in older cities *Population loss in many older suburbs *Continued population increase in “distant” suburban areas
Anticipated Consequences of the Census 2010 for the House of Representatives This is based on the Census Bureau’s December, 2009 estimates of population by as of July 1, 2009 projected forward to April 1, 2010 assuming a persistence of the 2008 to 2009 growth rate. • Gain 4 seats: Texas • Gain 1 seat: Arizona, Florida, Georgia, Nevada, South Carolina, Utah and Washington • Lose 1 seat: Illinois, Iowa, Louisiana, Massachusetts, Michigan, Minnesota, New Jersey, New York and Pennsylvania • Lose 2 seats: Ohio • States that will just miss retaining or gaining one seat: Minnesota (7, 200); Oregon (21,700) and Arizona (51,100) • States that could lose a seat or gain one fewer seat: Missouri (9,400); South Carolina (20,000); Washington (27,800) and Texas (34,200) • Minimum size of Congress required to ensure that no state loses a seat: 469 seats v. 435 at present • If New York’s population increased by 25,000 Haitian immigrants and Florida’s by 50,000; it would not shift any seats in Congress.
Distribution of Congressional and Electoral College Seats by Region; 1900 to 2010
Expected and Unexpected Findings from Census 2010- Racial and Ethnic Issues- • *A shift in the racial composition of the nation • * Rapid growth of the multiple race population • * Changes in the racial identification of Hispanics • * A suburbanization of the black population • * Declines in black-white residential segregation • * An increasing frequency of interracial marriage • * The appearance of many multiple-race households
Number of Races Reported: American Community Survey; 2000 to 2008
Percent of Persons Identifying with One Major Race Who Went On To Identify with a Second Major Race; American Community Survey: 2000 to 2008
Races Reported by the Hispanic Population: Census 2000 and ACS 2008 CENSUS 2000 ACS 2008
States where Non-Hispanic Whites were a Numerical Minority in 2008“Majority Minority States” Hawaii, District of Columbia, New Mexico, California and Texas Additional States where Non-Hispanic Whites were a Numerical Minority in 2008 among the School Age Population (Under age 18) Arizona, Nevada, Florida and Mississippi Additional States where Non-Hispanic Whites were a Numerical Minority in 2008 among the Pre-School Population (Under age 6) Maryland, Georgia, Delaware and New York
Percent of White and Black Wives and Husbands Under Age 30 Married to a Spouse of the Other Race, 1950 to 2007
Percent of Children Under Age 18 in Married Couple Families withParents of Different Races
Expected and Unexpected Findings from Census 2010- Demographic Patterns- • *An aging of the population in many areas • * Evidence of widespread low fertility • * Appearance of numerous natural decrease counties • * Declines in percent married-spouse present among the young • * Changes in reported cohabitation • * For the first time, the census will enumerate and tabulate same-sex married couples
Total Fertility Rates for States, 2008 Data from the 2008 American Community Survey
Indexes of Dissimilarity Measuring the Segregation of Blacks from Whites; • 2000 and 2007
Racial Composition of the Typical Residential Area ofWhites, Blacks, Hispanics and Asians for Metropolitan Areasof Two Million or More: 2000 and 2007
Per Capita Income in 2008 for Persons Age 21 and Percent Change in Constant Dollar Per Capita Income 1999 to 2008, for Most Prosperous States, New England States and Least Prosperous States
Percent of Population Age 25 to 39 Reporting a Four-Year College Education 2008 and Percentage Point Change: 2000 to 2008
Twelve Largest Multiple Races in 2008, their Percent Change in Size Since 2000 and Their Median Age in 2007
Racial Residential Segregation in Metropolises of Two Million or More, Measured by • Indexes of Dissimilarity; 2000 and 2007 • Hispanics • Hispanics • Blacks • Blacks