Download
1 / 13
130 likes | 208 Vues
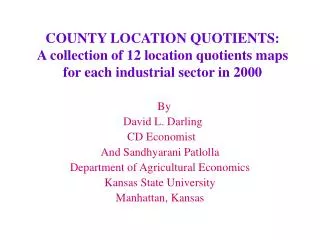
A collection of 12 location quotient maps for each industrial sector in 2000 by David L. Darling and Sandhyarani Patlolla. Explore the economic landscape of Kansas counties with detailed data visualization.

E N D
COUNTY LOCATION QUOTIENTS:A collection of 12 location quotients maps for each industrial sector in 2000 By David L. Darling CD Economist And Sandhyarani Patlolla Department of Agricultural Economics Kansas State University Manhattan, Kansas
Natural Resources Location Quotients Map-1 Maximum Value=9.08 (Wichita) Minimum value=.11 (Wyandotte)& (Johnson) County Average=3.399 Sandhyarani Patlolla David L. Darling June 2003 Republic 5.11 Nemaha 3.05 Brown 2.21 Washington 4.92 Marshall 3.10 Rawlins 6.79 Decatur 5.87 Norton 3.34 Phillips 4.08 Smith 4.53 Jewell 5.87 Doniphan 2.13 Cheyenne 6.45 Atchison 1.11 Mitchell 3.21 Cloud 2.18 Clay 2.97 Riley .55 Jackson 1.63 Pottawatomie 1.61 Sherman 3.29 Rooks 4.63 Osborne 4.47 Thomas 3.47 Sheridan 7.05 Graham 4.50 Jefferson 1.00 Leavenworth .34 Ottawa 2.55 Shawnee .18 Wyandotte .11 Lincoln 5.05 Geary .53 Logan 5.00 Trego 4.84 Ellis 1.45 Wabaunsee 2.21 Wallace 6.37 Gove 6.45 Russell 3.63 Dickinson 2.05 Douglas .26 Johnson .11 Saline .55 Ellsworth 3.21 Osage 1.29 Morris 3.11 Franklin 1.08 Miami .95 Greeley 8.10 Wichita 9.08 Rush 3.89 Barton 2.58 Scott 6.55 Lane 6.95 Lyon .71 Ness 6.84 McPherson 1.42 Rice 2.84 Marion 2.71 Chase 3.18 Coffey 2.32 Anderson 2.76 Linn 1.39 Pawnee 3.58 Hodgeman 6.03 Finney 2.00 Stafford 5.50 Hamilton 7.71 Kearny 5.92 Harvey .74 Reno 1.00 Greenwood 2.55 Woodson 2.82 Edwards 5.34 Allen 1.42 Bourbon 1.11 Gray 6.21 Butler .76 Ford 1.50 Sedgwick .21 Pratt 3.45 Stanton 7.82 Grant 5.24 Haskell 7.26 Kiowa 4.87 Kingman 3.05 Wilson 1.95 Neosho 1.21 Crawford .58 Elk 4.84 Meade 5.74 Clark 5.47 Barber 4.29 Sumner 1.55 Cowley 1.08 Morton 6.58 Stevens 6.24 Seward 3.03 Comanche 5.26 Harper 3.40 Montgomery .95 Chautauqua 4.79 Cherokee 1.00 Labette 1.08 Red: Greater than 3.0 Blue: Lower than 1.0 Black: In between 1.0 & 3.0 Data Source: U.S. Census Bureau , Employment by industry data K –State Research and Extension.
Construction Location Quotients Map-2 Maximum Value=2.12 (Miami) Minimum value=0.68 (Logan) County Average=1.05 Sandhyarani Patlolla David L. Darling June 2003 Republic .92 Nemaha .83 Brown 1.18 Washington 1.37 Marshall .82 Cheyenne .72 Rawlins .95 Decatur 1.11 Norton .88 Phillips .94 Smith .83 Jewell 1.54 Doniphan 1.00 Atchison 1.05 Cloud .91 Mitchell .86 Clay 1.46 Riley .86 Jackson 1.43 Pottawatomie 1.54 Sherman 1.12 Rooks .95 Osborne 1.06 Thomas 1.03 Sheridan .75 Graham 1.31 Jefferson 1.62 Leavenworth 1.34 Ottawa 1.12 Shawnee .95 Wyandotte 1.17 Lincoln 1.18 Logan .68 Geary .82 Trego .83 Ellis .71 Wabaunsee 1.52 Wallace .98 Gove .95 Russell 1.03 Dickinson 1.18 Douglas .97 Johnson .85 Saline 1.12 Ellsworth .83 Morris 1.26 Osage 1.65 Franklin 1.34 Miami 2.12 Greeley 1.09 Wichita .91 Rush .98 Barton .92 Scott 1.12 Lyon .75 Lane .78 Ness .88 Rice .89 Marion 1.00 Chase .92 McPherson 1.03 Coffey 1.32 Anderson 1.72 Linn 2.02 Pawnee .94 Hodgeman .72 Finney 1.17 Stafford .80 Hamilton .89 Kearny .97 Harvey .98 Reno .95 Greenwood 1.52 Woodson 1.14 Allen 1.03 Edwards .91 Bourbon .94 Gray 1.35 Butler 1.12 Ford .89 Sedgwick .92 Pratt .89 Stanton 1.02 Grant 1.34 Haskell .85 Kiowa .80 Kingman 1.00 Wilson 1.69 Neosho 1.15 Crawford .94 Elk 1.40 Meade .95 Clark .83 Barber .88 Sumner .95 Cowley 1.03 Morton .74 Stevens .98 Seward .69 Comanche 1.15 Harper .72 Montgomery .71 Chautauqua 1.12 Cherokee 1.31 Labette .72 Red: Higher than 1.20 Blue: Lower than 0.85 Black: In between 0.85 & 1.20 Data Source: U.S. Census Bureau , Employment by industry data K –State Research and Extension.
Manufacturing Location Quotients Map-3 Maximum Value=1.78 (Allen) Minimum value=0.1 (Sheridan) County Average=0.764 Sandhyarani Patlolla David L. Darling June 2003 Nemaha 1.11 Brown .73 Washington .69 Marshall 1.01 Rawlins .19 Decatur .13 Norton .26 Phillips .75 Smith .53 Jewell .33 Republic .75 Doniphan 1.01 Cheyenne .19 Cloud .74 Atchison 1.21 Thomas .19 Sheridan .10 Clay .82 Riley .25 Jackson .71 Pottawatomie .65 Sherman .25 Rooks .74 Osborne .77 Mitchell .62 Graham .11 Jefferson .84 Leavenworth .57 Lincoln .70 Ottawa 1.01 Shawnee .61 Wyandotte .96 Wallace .20 Geary .73 Trego .23 Ellis .43 Wabaunsee .78 Logan .15 Gove .29 Russell 0.60 Dickinson .86 Douglas .61 Johnson .64 Saline 1.15 Ellsworth .73 Osage .69 Morris .89 Franklin 1.05 Miami 0.85 Greeley .19 Wichita .28 Rush .85 Barton .77 Scott .23 Lane .14 Lyon 1.51 Ness .22 Rice .81 Marion 1.11 Chase .97 McPherson 1.67 Coffey .64 Anderson .82 Linn .68 Pawnee .20 Hodgeman .39 Finney 1.47 Stafford .40 Hamilton .12 Kearny .58 Harvey 1.40 Reno 1.12 Greenwood .84 Woodson 1.25 Allen 1.78 Edwards .88 Bourbon 1.32 Gray .42 Butler 1.70 Ford 1.67 Sedgwick 1.63 Pratt .25 Stanton .35 Grant .41 Haskell .30 Kiowa .25 Kingman 1.23 Wilson 1.69 Neosho 1.6 Crawford 1.13 Elk 1.03 Meade .35 Clark .25 Barber .61 Sumner 1.63 Cowley 1.54 Morton 0.16 Stevens .31 Seward 1.52 Comanche .40 Harper 1.15 Montgomery 1.74 Chautauqua .72 Cherokee 1.70 Labette 1.45 Red: Higher than 1.00 Blue: Lower than 0.5 Black: In between 0.5 & 1.00 Data Source: U.S. Census Bureau , Employment by industry data K –State Research and Extension.
Wholesale trading Location Quotients Map-4 Maximum Value=2.73 (Wilson) Minimum value=.27 (Woodson) County Average=.93 Sandhyarani Patlolla David L. Darling June 2003 Nemaha .73 Brown .76 Republic 1.12 Washington .70 Marshall .67 Rawlins .97 Decatur 1.06 Norton .58 Phillips .55 Smith .61 Jewell .76 Doniphan 1.21 Cheyenne .79 Atchison .97 Cloud 1.58 Clay .76 Riley .45 Jackson .79 Pottawatomie .82 Sherman 1.33 Rooks .97 Osborne .91 Mitchell 2.33 Thomas 1.24 Sheridan 1.45 Graham .58 Jefferson .67 Leavenworth .76 Ottawa .97 Shawnee .94 Wyandotte 1.27 Lincoln .67 Logan .82 Geary .79 Trego .36 Ellis .67 Wabaunsee 1.06 Wallace 1.91 Gove .82 Russell .36 Dickinson 1.06 Douglas .55 Johnson 1.45 Saline 1.00 Ellsworth .79 Morris 1.03 Osage .94 Franklin .85 Miami .91 Greeley 1.03 Wichita .64 Rush 1.21 Barton 1.33 Scott .85 Lane 1.76 Lyon .76 Ness .82 Rice .82 Marion .94 Chase 1.12 McPherson .67 Coffey .67 Anderson .42 Linn .85 Pawnee .79 Hodgeman .45 Finney 1.15 Stafford 1.15 Hamilton .85 Kearny .70 Harvey .79 Reno 1.03 Greenwood .76 Woodson .27 Edwards 1.12 Allen .79 Bourbon 1.79 Gray 1.58 Butler .64 Ford 1.12 Sedgwick .97 Pratt 1.30 Stanton 1.48 Grant .88 Haskell 1.36 Kiowa 1.12 Kingman .76 Wilson 2.73 Neosho .70 Crawford .94 Elk .48 Meade .91 Clark .61 Barber 1.09 Sumner .76 Cowley .55 Morton .76 Stevens .94 Seward .82 Comanche 1.18 Harper .67 Montgomery .67 Chautauqua .48 Cherokee .85 Labette .67 Red: 1.15 & higher Blue: 0.67 & lower Black: In between 0.67 & 1.15 Data Source: U.S. Census Bureau , Employment by industry data K –State Research and Extension.
Retailing Location Quotients Map-5 Maximum Value=1.39 (Geary) Minimum Value=.49 (Rush) County Average=.924 Sandhyarani Patlolla David L. Darling June 2003 Nemaha .94 Brown .78 Washington .94 Marshall .94 Rawlins .83 Decatur .95 Norton 1.26 Phillips .81 Smith 1.10 Jewell .80 Republic 1.10 Doniphan .87 Cheyenne 1.28 Atchison .86 Mitchell .95 Cloud 1.13 Clay .95 Riley 1.15 Jackson .88 Pottawatomie .90 Sherman 1.43 Rooks .83 Osborne 1.03 Thomas 1.15 Sheridan .96 Graham .90 Jefferson .96 Leavenworth .98 Lincoln .81 Ottawa .98 Shawnee .99 Wyandotte .99 Wallace .75 Geary 1.39 Trego 1.07 Ellis 1.17 Wabaunsee .81 Logan 1.29 Gove .83 Russell .86 Dickinson 1.35 Douglas 1.03 Johnson 1.04 Saline 1.09 Ellsworth .91 Osage 1.22 Morris .77 Franklin 1.27 Miami 1.01 Ness .73 Greeley .90 Wichita .75 Rush .49 Barton 1.12 Scott .96 Lane .68 McPherson .76 Lyon 1.01 Rice .90 Marion .83 Chase .74 Coffey .81 Anderson 1.28 Linn .96 Pawnee .86 Hodgeman 1.08 Finney 1.05 Stafford .60 Hamilton .67 Kearny .82 Harvey .93 Reno 1.21 Greenwood .86 Woodson .90 Edwards .79 Allen .99 Bourbon .88 Gray .79 Butler .87 Ford .97 Sedgwick .99 Pratt 1.12 Stanton .79 Grant .70 Haskell .82 Kiowa .74 Kingman .90 Wilson .61 Neosho 1.00 Crawford .81 Elk .62 Meade .79 Clark .81 Barber .82 Sumner .81 Cowley .77 Morton .72 Stevens .99 Seward .98 Comanche .58 Harper .80 Montgomery 1.04 Chautauqua .53 Cherokee .90 Labette .90 Red: 1.00 or Higher Blue: Lower than 0.65 Black: In between 0.65 & 1.00 Data Source:U.S. Census Bureau , Employment by industry data K –State Research and Extension.
Trans(T,W,U) Location Quotients Map-6 Maximum Value=3.31 Minimum value=.27 County Average=1.24 Sandhyarani Patlolla David L. Darling June 2003 Republic 1.44 Nemaha 1.38 Brown 1.08 Washington .94 Marshall 1.85 Rawlins 1.13 Decatur 1.23 Norton 1.19 Phillips 1.60 Smith 1.63 Jewell 1.37 Doniphan 1.15 Cheyenne 1.19 Atchison 1.00 Mitchell 1.00 Cloud 1.37 Clay .92 Riley .42 Jackson 1.31 Pottawatomie 1.31 Sherman 1.00 Rooks 1.40 Osborne 1.17 Thomas 1.08 Sheridan 1.40 Graham 1.17 Jefferson 1.31 Leavenworth 1.29 Ottawa 1.40 Shawnee 1.29 Wyandotte 1.63 Lincoln 5.05 Geary .92 Logan 1.48 Trego 1.85 Ellis .88 Wabaunsee 1.50 Wallace 1.54 Gove 1.10 Russell 3.63 Dickinson 1.48 Douglas .60 Johnson .85 Saline .85 Ellsworth 1.02 Morris 1.42 Osage 1.54 Franklin 1.17 Miami 1.19 Greeley 1.35 Wichita 1.71 Rush 1.31 Barton 1.02 Scott 1.08 Lane 2.02 Lyon .87 Ness 1.08 McPherson .77 Rice 1.44 Marion 1.06 Chase 1.12 Coffey 3.31 Anderson 1.58 Linn 1.90 Pawnee 1.04 Hodgeman 1.35 Finney 1.02 Stafford 1.27 Hamilton 1.33 Kearny 1.60 Harvey .81 Reno .88 Greenwood .81 Woodson 1.44 Edwards .98 Allen .96 Bourbon .81 Gray 1.27 Butler .83 Ford .96 Sedgwick .75 Pratt 1.46 Stanton 1.25 Grant 2.29 Haskell 1.65 Kiowa 1.94 Kingman 1.27 Wilson .27 Neosho .96 Crawford .73 Elk 1.35 Meade 1.63 Clark 1.35 Barber 1.42 Sumner 1.31 Cowley 1.04 Morton 1.25 Stevens 1.98 Seward 1.17 Comanche 1.33 Harper .96 Montgomery .92 Chautauqua 1.21 Cherokee 1.06 Labette 1.06 Red: 1.48 and Greater Blue: 0.96 &Lower Black: In between .96 & 1.48 Data Source: U.S. Census Bureau , Employment by industry data K –State Research and Extension.
Maximum Value=2.27(Johnson) Minimum value=0.12 (Stafford) County Average= .57 Information Location Quotients Map-7 Sandhyarani Patlolla David L. Darling June 2003 Republic .48 Nemaha .52 Brown .42 Washington .48 Marshall .27 Rawlins .79 Decatur .42 Norton .82 Phillips .52 Smith .42 Jewell .42 Doniphan .45 Cheyenne .30 Atchison .36 Mitchell .42 Cloud .61 Thomas .64 Clay .42 Riley .76 Jackson .42 Pottawatomie .61 Sherman 1.12 Rooks 1.18 Osborne .55 Sheridan .12 Graham .67 Jefferson .61 Leavenworth 1.12 Ottawa .48 Shawnee 1.15 Wyandotte 1.00 Lincoln 0.33 Geary 1.00 Wallace .55 Logan .67 Trego .39 Ellis .70 Wabaunsee .61 Gove .61 Russell .61 Dickinson .67 Douglas 1.33 Johnson 2.27 Saline .76 Ellsworth .76 Osage .58 Morris .24 Franklin .76 Miami 1.27 Greeley .64 Wichita .30 Rush .76 Barton .39 Scott .15 Lane .27 Lyon .97 Ness .45 McPherson .48 Rice .55 Marion .45 Chase .67 Coffey .67 Anderson .52 Linn .52 Pawnee .30 Hodgeman .30 Finney .36 Stafford .12 Hamilton .52 Kearny .45 Harvey .64 Reno .67 Greenwood .39 Woodson .52 Edwards .42 Allen .55 Bourbon .52 Gray .33 Butler .52 Ford .58 Sedgwick .67 Pratt .24 Stanton .27 Grant 1.18 Haskell .21 Kiowa .48 Kingman .33 Wilson 1.18 Neosho .39 Crawford .48 Elk .27 Meade .39 Clark .21 Barber .24 Sumner .58 Cowley .48 Morton .85 Stevens .27 Seward .36 Comanche .24 Harper .24 Montgomery .73 Chautauqua .61 Cherokee .30 Labette .45 Red: Greater than 0.70 Blue: Lower than 0.35 Black: In between 0.35 & 0.70 Data Source: U.S. Census Bureau , Employment by industry data K –State Research and Extension.
FIRE Location Quotients Map-8 Maximum Value=1.66(Johnson) Minimum value=0.39(Greeley) County Average=.73 Sandhyarani Patlolla David L. Darling June 2003 Republic .57 Nemaha .56 Brown .74 Washington .56 Marshall .77 Rawlins .61 Decatur .79 Norton .64 Phillips .87 Smith .87 Jewell .56 Doniphan .72 Cheyenne .69 Atchison .70 Mitchell .89 Cloud .52 Clay .64 Riley .93 Jackson 1.02 Pottawatomie .77 Sherman Rooks .64 Osborne .79 Thomas .87 Sheridan .74 Graham .64 Jefferson 1.02 Leavenworth 1.07 .80 Ottawa .75 Shawnee 1.31 Wyandotte .97 Lincoln .52 Geary .69 Logan .84 Trego .70 Ellis .64 Wabaunsee .92 Wallace .55 Gove .72 Russell .93 Dickinson .69 Douglas .95 Johnson 1.66 Saline .79 Ellsworth .62 Morris .72 Osage .77 Franklin .77 Miami 1.21 Greeley .39 Wichita .64 Rush .57 Barton .84 Scott .77 Lane .97 Lyon .61 Ness .45 McPherson .89 Rice .67 Marion .67 Chase .57 Coffey .59 Anderson .69 Linn 1.11 Pawnee .59 Hodgeman .66 Finney .61 Stafford .57 Hamilton .61 Kearny .44 Harvey .69 Reno .66 Greenwood .80 Woodson .64 Edwards .48 Allen .57 Bourbon 1.33 Gray .79 Butler .84 Ford .72 Sedgwick .90 Pratt .57 Stanton .41 Grant .74 Haskell .54 Kiowa .41 Kingman .77 Wilson .75 Neosho .54 Crawford .62 Elk .46 Meade .51 Clark .70 Barber .79 Sumner .62 Cowley .54 Montgomery .62 Morton .57 Stevens .75 Seward .57 Comanche .72 Harper .72 Chautauqua .59 Cherokee .56 Labette .54 Red: 0.87 & Greater Blue: 057 & Lower Black: In between 0.57 & 0.87 Data Source: U.S. Census Bureau , Employment by industry data K –State Research and Extension.
Maximum Value=2.86(Wilson) Minimum value=0.21(Wichita) County Average=.58 Professional Location Quotients Map-9 Sandhyarani Patlolla David L. Darling June 2003 Republic .51 Nemaha .49 Brown .42 Washington .39 Marshall .39 Rawlins .51 Decatur .51 Norton .39 Phillips .36 Smith .38 Jewell .32 Doniphan .57 Cheyenne .69 Atchison .33 Mitchell .54 Cloud .38 Clay .56 Riley 1.01 Jackson .56 Pottawatomie .57 Sherman .44 Rooks .35 Osborne .49 Thomas .53 Sheridan .51 Graham .61 Jefferson .79 Leavenworth 1.11 Ottawa .69 Shawnee .99 Wyandotte 1.22 Lincoln .50 Geary .75 Logan .26 Trego .42 Ellis 1.08 Wabaunsee .50 Wallace .68 Gove .33 Russell .78 Dickinson .39 Douglas 1.14 Johnson 1.88 Saline .75 Ellsworth .71 Osage .64 Morris .49 Franklin .69 Miami .93 Greeley .56 Wichita .21 Rush .60 Barton .68 Scott .74 Lane .31 Lyon .49 Ness .42 McPherson .50 Rice .56 Marion .40 Chase .58 Coffey .32 Anderson .36 Linn .64 Pawnee .44 Hodgeman .38 Finney .49 Stafford .46 Hamilton .46 Kearny .36 Harvey .50 Reno .74 Greenwood .60 Woodson .54 Edwards .49 Allen .35 Bourbon .49 Gray .50 Butler .69 Ford .56 Sedgwick 1.00 Pratt .42 Stanton .32 Grant .44 Haskell .58 Kiowa .54 Kingman .61 Wilson 2.86 Neosho .47 Crawford .83 Elk .38 Meade .35 Clark .64 Barber .60 Sumner .42 Cowley .43 Morton .43 Stevens .44 Seward .61 Comanche .35 Harper .50 Montgomery .79 Chautauqua .47 Cherokee .46 Labette .54 Red: 0.69 & Greater Blue: 0.39 & Lower Black: In between 0.39 & 0.69 Data Source: U.S. Census Bureau , Employment by industry data K –State Research and Extension.
Educational, health social & other services Location Quotients Map-10 Maximum value= 1.59 (Riley) Minimum value= 0.16 (Wilson) County Average= 1.04 Sandhyarani Patlolla David L. Darling June 2003 Nemaha 1.05 Brown 1.09 Cheyenne 0.9 Republic .81 Marshall 1.01 Rawlins 1.02 Decatur 1.08 Norton .97 Phillips 1.09 Smith 1.15 Jewell .96 Washington 1.04 Doniphan 1.14 Atchison 1.24 Cloud 1.20 Clay 1.19 Riley 1.59 Jackson .94 Pottawatomie 1.23 Sherman 1.01 Rooks .90 Osborne .93 Mitchell 1.01 Thomas 1.19 Sheridan .97 Graham 1.30 Jefferson 1.01 Leavenworth 1.03 Ottawa .96 Shawnee 1.02 Wyandotte .83 Lincoln 1.07 Geary .99 Trego .97 Ellis 1.38 Wabaunsee 1.11 Wallace .76 Logan .96 Gove 1.12 Russell 1.06 Dickinson .89 Douglas 1.34 Johnson .86 Saline 1.02 Ellsworth 1.03 Osage .89 Morris 1.02 Franklin .97 Miami .86 Greeley .95 Wichita .85 Rush 1.10 Barton 1.07 Scott .97 Lane .84 Lyon 1.03 Ness 1.11 Rice 1.25 Marion 1.24 Chase .84 McPherson 1.05 Coffey 1.00 Anderson .94 Linn .99 Pawnee Hodgeman 1.09 Finney .88 Stafford 1.31 Hamilton .86 Kearny 1.11 Harvey 1.28 Reno 1.06 Greenwood 1.10 Woodson .82 Edwards .98 Allen .98 Bourbon 1.04 Gray .87 Butler .97 Ford .88 Sedgwick .89 Pratt 1.11 Stanton .86 Grant .76 Haskell .97 Kiowa 1.21 Kingman 1.04 Wilson .16 Neosho 1.03 Crawford 1.38 Elk 1.05 Meade 1.06 Clark 1.34 Barber 1.15 Sumner 1.03 Cowley 1.17 Morton 1.23 Stevens .85 Seward .75 Comanche 1.21 Harper 1.01 Montgomery .91 Chautauqua 1.30 Cherokee 1.00 Labette 1.21 Red: Higher than 1.00 Blue: Lower than 0.5 Black: In between 0.5 & 1.00 Data Source: U.S. Census Bureau , Employment by industry data K –State Research and Extension.
Maximum Value=1.59 (Brown) Minimum value=.36 (Greeley) County Average=.93 Other Services Location Quotients Map-11 Sandhyarani Patlolla David L. Darling June 2003 Republic .79 Nemaha .97 Brown 1.59 Washington .82 Marshall 1.00 Rawlins .86 Decatur .69 Norton 1.15 Phillips .88 Smith .61 Jewell .95 Doniphan .96 Cheyenne .74 Atchison 1.00 Mitchell .81 Cloud 1.01 Clay .81 Riley 1.36 Jackson 1.30 Pottawatomie .91 Sherman .99 Rooks .80 Osborne .74 Thomas 1.16 Sheridan .91 Graham .90 Jefferson .92 Leavenworth .91 Ottawa .84 Shawnee 1.00 Wyandotte 1.06 Lincoln .65 Geary 1.20 Logan 1.31 Trego 1.38 Ellis 1.23 Wabaunsee .66 Wallace .89 Gove .94 Russell 1.35 Dickinson .96 Douglas 1.30 Johnson .88 Saline 1.27 Ellsworth .89 Morris .90 Osage .86 Franklin .94 Miami .68 Greeley .36 Wichita .61 Rush .88 Barton 1.08 Scott .97 Lane .74 Lyon 1.22 Ness .90 McPherson 1.03 Rice .88 Marion .89 Chase 1.18 Coffey .79 Anderson .77 Linn .74 Pawnee .88 Hodgeman .74 Finney .85 Stafford .84 Hamilton 1.06 Kearny .62 Harvey .97 Reno 1.07 Greenwood .90 Woodson .90 Edwards .67 Allen .81 Bourbon .85 Gray .62 Butler .97 Ford .90 Sedgwick 1.06 Pratt 1.32 Stanton .73 Grant 1.02 Haskell .66 Kiowa .99 Kingman .67 Wilson .69 Neosho .93 Crawford 1.16 Elk .76 Meade 1.00 Clark .59 Barber .90 Sumner .91 Cowley 1.01 Morton .72 Stevens .95 Seward 1.04 Comanche 1.02 Harper 1.22 Montgomery 1.00 Chautauqua .81 Cherokee .90 Labette 1.02 Red: 1.06 & Greater Blue: .74 & Lower Black: In between .74 & 1.06 Data Source: U.S. Census Bureau , Employment by industry data K –State Research and Extension.
Public Administration Location Quotients Map-12 Maximum value=2.52(Norton) Minimum=.45 (Scott) County Average=1.054 Sandhyarani Patlolla David L. Darling June 2003 Nemaha .70 Brown 1.39 Cheyenne 1.09 Washington .86 Marshall .66 Rawlins .98 Decatur 1.41 Norton 2.52 Phillips .93 Smith 1.04 Jewell 1.09 Republic .86 Doniphan 1.00 Atchison 1.32 Cloud .82 Clay .91 Riley 1.25 Jackson 1.61 Pottawatomie 1.34 Sherman 1.16 Rooks 1.27 Osborne .98 Mitchell 1.55 Thomas .84 Sheridan .80 Graham 1.18 Jefferson 1.48 Leavenworth 2.25 Ottawa .93 Shawnee 2.27 Wyandotte 1.11 Lincoln 1.23 Geary 2.25 Trego .80 Ellis 1.07 Wabaunsee 1.43 Wallace 1.41 Logan .86 Gove .64 Russell .75 Dickinson 1.14 Douglas .89 Johnson .70 Saline .75 Ellsworth 2.00 Morris 1.23 Osage 1.89 Franklin .80 Miami .86 Greeley 1.16 Wichita .84 Ness .77 Rush 1.16 Barton .86 Scott .45 Lane 1.43 Lyon .91 Rice .68 Marion .57 Chase 1.68 McPherson .48 Coffey 1.14 Anderson .84 Linn 1.00 Pawnee 1.95 Hodgeman 1.16 Finney .91 Stafford 1.11 Hamilton 1.32 Kearny .93 Harvey .7 Reno .95 Greenwood 1.39 Woodson 1.45 Edwards 1.27 Allen .80 Bourbon .86 Gray 1.05 Butler .86 Ford .82 Sedgwick .75 Pratt 1.27 Stanton 1.5 Grant .52 Haskell .59 Kiowa .93 Kingman .77 Wilson .86 Neosho .86 Crawford .84 Elk .68 Meade 1.00 Clark 1.41 Barber .66 Sumner .70 Cowley 1.07 Morton 1.05 Stevens .48 Seward .77 Comanche .64 Harper .84 Montgomery .75 Chautauqua .66 Cherokee .80 Labette .95 Red: 1.01 & Greater Blue: 0.75 & Lower Black: In between 0.75 & 1.01 Data Source: U.S. Census Bureau , Employment by industry data K –State Research and Extension.