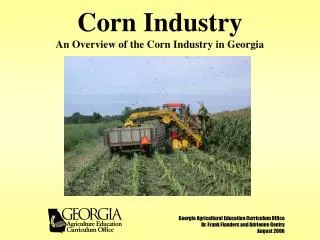
Corn Industry Trends: From Ag Revolutions to Biotechnology and Beyond
Explore the evolution of the corn industry from historical agricultural revolutions to modern biotechnological advancements. Delve into fundamental demand shifts driven by world population growth and changing consumption patterns. Can we challenge Malthusian theory with yield enhancement and drought tolerance innovations? Discover how North Dakota's corn yields stabilized and increased through traits like Bt technology and stacking. Uncover the economic and environmental impacts of corn production, including energy usage, climate emissions, and pesticide trends.

Corn Industry Trends: From Ag Revolutions to Biotechnology and Beyond
E N D
Presentation Transcript
Corn Industry Trends Tom Lilja tom@ndcorn.org December 18, 2013
Ag Revolutions Mechanical – 1794 Cotton Gin Chemical – Post World War II Financial – 1980’s collapse Biotechnology – mid 1990’s Protein Revolution today?? Or Logistical?? Fundamental Demand Changes Occurring
World Population Millions
Per Capita GDP Rates in SE Asia China India
Doubting Thomas Malthusian Theory – population is inclined to increase more rapidly than the supply of food that such growth necessitates Can we disprove Malthus?
YieldEnhancement DroughtTolerance
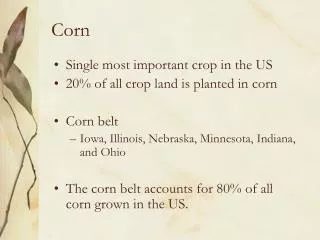
What Helped Stabilize Yield? • Corn Borer trait (Bt) introduction 1997 Southeast North Dakota NK 3030 115 bushels / acre NK 3030BT141bushels / acre • Roundup Ready technology in corn and soybeans has not stunted plant growth as with traditional chemicals • Corn Rootworm Traits • Stacking of Traits
Supply Side Economics ?? 90 bushels / acre – mid 1990’s 115 bushels / acre – 2012 25 extra bushels across 3.5 million acres Or Bonanza?? 87.5 million more bushels x $6.67 USDA $584 million more to ND economy $2.47 Billion (2004-2008) CAPTS, NDSU $9.7 Billion (2008-2012) CAPTS, NDSU
Corn’sImpacts,1987-2007 SoilLoss Soillossper bushel,abovea tolerablelevel LandUse Amountofland toproduceone bushelofcorn Irrigation Irrigationwater useperbushel Energy Energyusedto produceone bushel Climate Emissionsper bushel 37%69%27%37%30%
PesticideUseTrends Increasingadoptionofhybridswithinsect-resistantand herbicide-toleranttraitshavegreatlyreducedtheneedfor syntheticapplicationsofherbicidesandinsecticides. InsecticidePoundsPerAcre HerbicidePoundsPerAcre 0.35 0.3 0.25 0.2 0.15 0.1 0.05 0 3.5 3 2.5 2 1.5 1 0.5 0 2000 1995 1990 2005 1990 1992 1994 1996 1998 2000 2002 2005 Source:USDA
COMMERCIALNITROGENAPPLIEDPERBUSHELOFCORNPRODUCED PoundsperBushel 1.80 1.60 1980-2006ACTUAL&TRENDTO2030 Actual Trend 1.40 1.20 1.00 0.80 0.60 CornGrowersBecome MoreEfficientWithNitrogen 0.40 0.20 0.00 2030 1980198519901995 2010 2005 2025 2000 2015 2020 Source:Blue,Johnson&Associates,Inc. Source:Blue,Johnson&Assoc.Inc.
Enjoy the Value Added Summit Contact Info Tom Lilja – tom@ndcorn.org Greg LaPlante – greg@ndcorn.org