Mastering Graph Drawing: A Practical Guide for Exam Success
Learn how to draw essential graphs with accuracy and clarity to excel in exams. Follow expert advice to communicate effectively and score points. Practice sessions included.

Mastering Graph Drawing: A Practical Guide for Exam Success
E N D
Presentation Transcript
Drawing Graphs Aidan O’Donnell Chang Kim Tom Burrows Waikato Part 1 Course 2015
What’s the point? • In the exam, success depends on facts expressed per unit time • Viva • SAQ • Drawing a nice big clear graph is a good way to express your knowledge, look good and gain marks all at once
What’s the point? • The number of graphs you need to be able to draw is finite • Practising with graphs is a sensible thing: • Consolidates your knowledge • Makes it easier and quicker in the exam • “Money for jam”
What’s the point? • We can’t cover every single graph here • We will start with 20 • The principles can be applied to other graphs you will come across in your revision
Plan for this session • Some sensible overview points • Each candidate: one graph • Couple of minutes to elaborate
Point 1: Consideration • Appreciate graphs from an examiner’s viewpoint
Point 2: Confidence • Draw big graphs • Take a fresh piece of paper for each new graph • Leave space to add more information
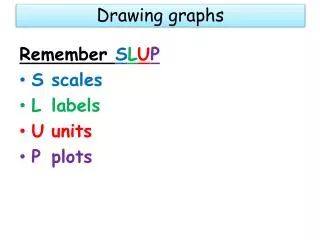
Point 3: Clarity • Draw simple graphs • Draw accurate graphs
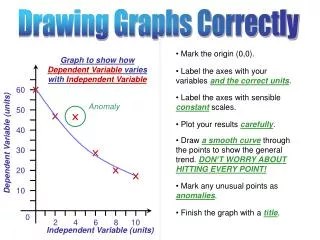
Point 4: Score points • Learn to talk while drawing • Get to the money quickly • Label axes briefly • Draw graphs to the axes (where appropriate)
Point 5: Communicate • Employ buzz words • Only draw what can’t be spoken more effectively • Effective expression is more important than tidyness • Consider different colours
Graph 1 • Draw a spirometry trace
Fundamentals: • Accurate axes • Four volumes • Three capacities (ml/kg for all) • Point of lung-chest wall balance • FRC: definition and measurement • RV: definition and measurement • Changes with pregnancy
Graph 2 • Draw a graph of single-breath nitrogen washout
Fundamentals: • Buzzwords: • ‘Fowler’s method of measuring anatomical deadspace’ • ‘Rapid nitrogen analyser measurement’ • ‘Single breath 100% oxygen inhaled’ • Trigger Knowledge Boxes: • How to measure physiological deadspace? • Drawing expired nitrogen against time
Graph 3 • Draw a graph of the oxygen cascade
Fundamentals: • The six main steps • Explain the graph as you draw it • Trigger Knowledge Boxes: • The alveolar gas equation + values for all aspects • The cause for each drop • The Pasteur Point and its significance • Effect of altitude
Graph 4 • Draw the oxyhaemoglobin dissociation curve
Fundamentals: • The four standard conditions • p50, p75 and p97 • The sigmoid shape: positive cooperativity • Trigger Knowledge Boxes: • Saturation vs content • Mechanism of positive cooperativity • Changes in working muscle/placenta/fetus • Myoglobin
Graph 5 • Draw the flow-volume loop for the human lung
PEFR 10 5 Flow (l/s) TLC FRC RV 0 5 -5
Fundamentals: • Draw graph clockwise and talk as you go • Buzz Words • ‘Forced Vital Capacity/Total Lung Capacity inhalation’ • ‘Maximal expiratory effort’ • ‘Dynamic airway compression / Equal Pressure Point’ • Trigger Knowledge Boxes: • Obstructive/ restrictive exhalation changes • Extra-thoracic exhalation changes • Factors affecting dynamic airways compression
Graph 6 • Draw a graph of static lung compliance
Fundamentals: • The Graph: • Residual Volume At Y Axis • Extension to LEFT Of Y Axis • Buzzwords: • ‘Steady State’ • ‘Hysteresis’ • Trigger Knowledge Boxes: • Causes Of Hysteresis [6] • Parts Of Lung At Each Part Of Curve • Lung Effects At Extremes Of Curve
Graph 7 • Draw a graph to illustrate work of breathing
Fundamentals: • The Graph: • Draw curve anticlockwise and talk as you go • All negative inspiratory pressure • Y-axis starts at FRC • ‘Normal Breathing’ • Buzzwords: • ‘Non-Equilibrated Lung Units’ • Trigger Knowledge Boxes: • Slanting line is dynamic compliance
Graph 8 • Draw a graph of the central venous pressure
Fundamentals: • 3 peaks (a,c,v); 2 troughs (x,y) • Physiological causes Of waveform • Buzzwords: • Central venous pressure = right atrial pressure • Trigger Knowledge Boxes: • Factors affecting baseline (4) • Factors altering amplitude • Relationship to PAOP
Graph 9 • Draw a graph representing the waveforms as you advance a pulmonary artery catheter from the SVC into the PA
25/0 25/12 5 10 Should look like a normal CVP waveform Should have no notches! Diastolic pressure should be zero! Should look like a normal CVP waveform (higher baseline) Should look like a normal art line trace, with dicrotic notch Not a very good diagram!! A real catheter advances much more slowly than this, so many more examples of each waveform would be expected (e.g. several screens)
Fundamentals: • 4 phases (Pressures in each) • Buzzwords: • ‘Pulmonary artery flotation catheter’ (not ‘Swan’) • Talk about measured vs derived variables • Trigger Knowledge Boxes: • RA pressure • West zones • Pulmonary hypertension • How does PAOP relate to LVEDV? • Measurement of cardiac output
Graph 10 • Draw a pressure-volume loop for the left ventricle
Fundamentals: • The 10 pieces of data obtainable • The 3 phases of systole and 4 of diastole • Buzzwords: • ‘LV End Diastolic Volume’ • ‘Lusitropy’ • Trigger Knowledge Boxes: • Factors altering shape of graph • Factors affecting position of graph • Note: by convention, pressure is on the y-axis and volume on the x-axis (the opposite to those in respiratory physiology, e.g. graph 7)
Graph 11 • Draw a graph of the cardiac action potential
Fundamentals: • Phases 0 to 4 • Draw a clear X-axis • Contrast with: • Skeletal muscle cell action potential • Pacemaker action potential • Buzzwords: • ‘Action potential of ventricular myocyte’ • ‘All or nothing phenomenon’ • Absolute vs relative refractory periods • Relationship to ST segment of ECG