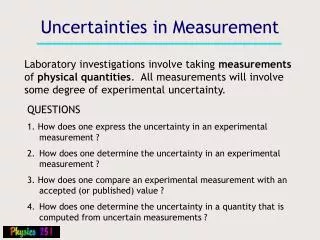
UNCERTAINTIES IN MEASUREMENTS
290 likes | 950 Vues
UNCERTAINTIES IN MEASUREMENTS. PROPERLY PROCESSING DATA. MEASUREMENTS WITH UNCERTAINTIES. This ruler measures to the mm (0.1 cm). Every measurement made with a ruler like this has an uncertainty of ± 0.05cm. This is half the smallest division. This measurement is 1.02 ± 0.05 cm. .

UNCERTAINTIES IN MEASUREMENTS
E N D
Presentation Transcript
UNCERTAINTIES IN MEASUREMENTS PROPERLY PROCESSING DATA
MEASUREMENTS WITH UNCERTAINTIES This ruler measures to the mm (0.1 cm) Every measurement made with a ruler like this has an uncertainty of ± 0.05cm. This is half the smallest division. This measurement is 1.02 ± 0.05 cm. It lies somewhere between 0.97 cm and 1.07 cm. Every measurement has a doubtful digit. Notice that the measurement and the uncertainty have the same level of precision.
MEASUREMENTS WITH UNCERTAINTIES This stopwatch measures to 0.01 seconds. This measurement could be 3min and 53.170 seconds or 3 min and 53.179 seconds. This means the uncertainty is ±0.01 seconds and the measurement is 237.17 ± 0.01s. Every measurement has a doubtful digit.
Measurement, measurement For number of repeated values, we find the average. The uncertainty in the average is plus or minus one-half of the range between the maximum value and the minimum value. For IB labs, each measurement needs to be repeated at least 3 times.
Recording the data Raw data should be presented in an easy to understand data table. The headings should state the name of the quantity, its symbol, the units it is measured in and its uncertainty.
Recording the data Of course, you will be measuring at least two variables. Here’s an example of using repeated values.
Recording the data Of course, you will be measuring at least two variables. Here’s an example of using repeated values.
Recording the data When dividing a measurement by a pure number, divide its uncertainty as well. Of course, you will be measuring at least two variables. Here’s an example of using repeated values.
Basic Rules This is called the absolute or raw uncertainty
Basic Rules This is called the fractional or relative uncertainty The relative uncertainty multiplied by 100% is called the percentage uncertainty.
Summary of the Basics When multiplying or dividing uncertainties, you ADD the PERCENTAGE uncertainties. When stating uncertainties the uncertainty must have 1 sig fig and must have the same level of precision of the measurement itself. When adding or subtracting uncertainties, you ADD the ABSOLUTE uncertainties.
Reciprocal calculation To straighten some curves, we use the reciprocal values. The uncertainties MUST be processed properly.
Power Function Some graphs need a variable raised to an exponent to be linearized. Again, the uncertainties MUST be properly processed.
You Try Calculate the volume of a sphere whose radius is measured to be
Gradient Uncertainties Error bars must be shown on the graph for the variable with the most significant uncertainty. Max value the data point could have Data point Min value the data point could have
Sample Graph This data has the responding variable with a fixed absolute value of uncertainty of ±2 cm
Sample Graph Here the uncertainty in the responding variable is a fixed percentage of 5%
Sample Graph Here is the best straight line. The variables are proportional since the best straight line passes through the origin (accounting for error) and through each point. But the slope measurement must have uncertainties associated with it as well.
Sample Graph To get the uncertainty in the slope value, we will look at the maximum slope and the minimum slope then calculate half the range.
Sample Graph The max slope is 25.357. The min slope is 19.643. The best slope is 23.226. We would record the slope as 23.226 ±2.857. With sig figs, it is 23 ±3.