U.S.-China Relationship Barometer 2013
The US-China Barometer measures the vital relationship between the U.S. and China, using objective data to assess differences and interactions. Explore key metrics in this comprehensive report.

U.S.-China Relationship Barometer 2013
E N D
Presentation Transcript
US-China Barometer 2013John S. & Marilyn Long U.S.-China Institute for Business & LawUniversity of California, Irvine The stated purpose of the Long Institute is to “…develop important relationships between the U.S. and China...” Toward that end the Institute annually publishes the US-China Barometer, a measure of perhaps the most important relationship between countries in the world. The Barometer provides a multidimensional representation of the relationship based on a compilation of most recent and pertinent data. Public and political opinion are eschewed. Indeed, we would hope that objective metrics would influence opinions rather than vice-versa. We have endeavored to collect and present the data objectively by using mostly third-party sources such as the World Bank. Where both American and Chinese sources exist we have discovered some substantial discrepancies – a good example is in Foreign Direct Investment. In the future we will collaborate with our colleagues in China toward determining the best ways to manage such discrepancies. We are also considering developing a summary statistic combining the various measures as a sort of index of the relationship that might be compared over the years. However, this effort is thwarted in two ways: First, the mathematical problem is not trivial – combining the numbers is a bit like comparing apples, oranges, and puppies. Second, important details are lost in a summary statistic. So we deliver the Barometer as a 20-slide power-point presentation with interpretive notes (see below each slide)and the data sets (right click then choose “edit data”)imbedded. Users and viewers are most welcome to adapt the presentation to their own purposes. Just don’t change the data. We expect and seek your criticism so that we might improve the Barometer in future years. Feel free to comment on our choice of metrics and our own biases that we have had trouble seeing. Please send your comments to John L. Graham at jgraham@uci.edu .
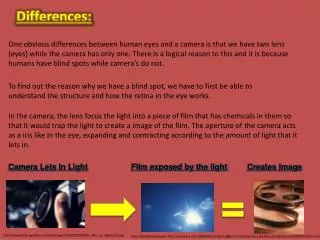
Differences The presentation is broken down into two sections. The first presents important differences across the two countries. The hope is that the differences will subside with the continued economic integration of the U.S. and China. We also look forward to improvements in both countries on all dimensions.
GDP per capita, PPP (current international $) Source: World Bank (WDI)
Life expectancy at birth (years) Source: World Bank (WDI)
Homicide rate (per 100,000) Source: UNDOC.org
Ratio of female to male tertiary enrollment Source: World Bank (WDI)
Internet users (%) Source: World Bank (WDI)
Energy use (kg of oil equivalent per capita) Source: World Bank (WDI)
CO2 emissions (metric ton per capita) Source: World Bank (WDI)
Corruption Perception Index (scores) Source: transparency.org
Piracy rates for computer software (% unlicensed use) Source: bsa.org/globalstudy
Unemployment rates (%) Source: World Bank (WDI)
Interaction The second group of slides presents measures of the increasing interaction of the two countries. In almost respects we see a strengthening of the bi-lateral relationship.
Trade in goods ($ billion) Source: census.gov
Total U.S.-China trade in goods and U.S. trade deficit in goods ($ billion) Source: census.gov
Historical dollar/yuan exchange rate Source: databank.worldbank.org
Chinese holdings of U.S. treasuries ($ billion) Source: treasury.gov
Travel between countries (thousands of passengers) Source: tinet.ita.doc.gov
Educational exchange students Source: iie.org
Chinese language training in higher education in U.S. (number of students) Source: mla.org
U.S. patents granted to invention teams that include both American and Chinese citizens Source: patft.uspto.gov
WTO complaints pending and settled Source: wto.org