Download
1 / 16
160 likes | 319 Vues
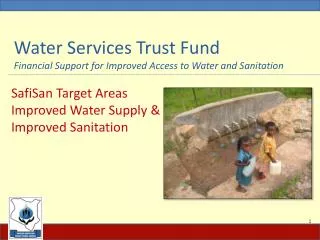
Financial Markets and Access to Capital for the Water Industry. James M. Kalinovich, VP Treasurer, American Water MARC Conference Traverse City, Michigan June 15, 2009. Ontario. WA. MT. ME. ND. VT. OR. MN. NH. ID. SD. NY. WI. MA. CT. WY. MI. RI. PA. IA. NJ. NE. NV. OH.

E N D
Financial Markets and Access to Capital for the Water Industry James M. Kalinovich, VP Treasurer, American Water MARC Conference Traverse City, Michigan June 15, 2009
Ontario WA MT ME ND VT OR MN NH ID SD NY WI MA CT WY MI RI PA IA NJ NE NV OH MD DE IN IL UT WV CO Washington DC CA KS VA MO KY NC TN AZ OK AR NM SC GA AL MS LA TX AK FL Hawaii American Water’s Regulated Presence American Water serves approximately 5% of the U.S. population
Facts & Figures (owned Assets) • 372 individual service areas • 46,000 miles of distribution mains • 80 surface water treatment plants • 600 groundwater treatment plants • 1,000 groundwater wells • 45 wastewater treatment plants
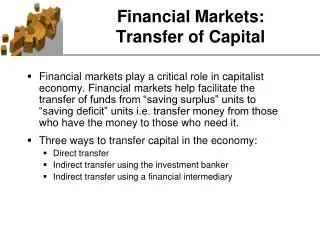
Background • Current financial and credit crises are causing severe challenges and dislocations throughout virtually every sector of the economy, but . . . No sector is more important to public health and welfare than high quality drinking water and sanitation services: • Water is ingested and essential to life • Critical infrastructure, such as energy, health care, fire fighting, disaster recovery, etc depend on water • Effective wastewater management is critical to health and environmental quality • Access to and cost of capital affected
Economic Crises’ Impact on AWK • Increases in cost of debt • Market volatility hampers new equity issuance and raises implied costs of equity • Potential effects on Capex program • Depressed housing sector hurts customer growth • Increase in bad debt expense • Credit Markets’ performance negatively impacts retirement plans assets, thus increasing the Pension and Other Post Retirement Benefits Costs and Cash Contributions
CBOE S&P Volatility Index LTM TED Spread Market Volatility still remains and is main factor for increased cost of capital The TED spread is the difference between the 3 month T bill and the 3 month LIBOR and is an indicator of perceived risk in the economy The VIX Index represents the market’s expectation of volatility of the S&P 500 over the next 30 day period During the month of April the VIX continued a sideways trading pattern, lower than October 2008 highs but still 50% higher than before onslaught of credit crisis in November 2008 TED spreads continue to show lower perceived market risk, as spreads to LIBOR have remained steady at around 100 basis points. TED spreads averaged 15 basis points from 2000-2005
Weighted Average Cost of Debt: By Subsidiary Current New Debt Issuance Rates: 6.5% to 8.5%
Spreads: 30 Year US Treasury Notes and “A” & “BBB+” Utilities Source: Spread History for “A” and “BBB+” Utilities on Bloomberg
Challenges: • Capital Attraction • Drinking Water: $334.8 Billion/20 years • February 2009 USEPA Drinking Water Infrastructure Needs Survey (2002 Estimate: $154 Billion) • Clean Water: $331-450 Billion/20 years • 2002 USEPA GAP Analysis • 20 Year Water/Wastewater Need: Approximately $1 Trillion • Fragmentation • 53,000 Community Water Systems • 3,200 Electric; 2,700 Gas • Expanding Water Quality Requirements • 98 Inorganic, Organic, Microbiological, Disinfection by Products, Radionuclides • More Coming
No Utility Sector is More Capital Intensive Than the Water Industry Source: AUS Utility Reports – 2008
Enhanced Importance of Policies that PromoteCapital Attraction • Reduction of Regulatory Lag • Prospectively relevant test years • Infrastructure replacement surcharges • Promotion of Consolidation • Economies of scale • Viability • Single tariff pricing
CAPITAL ATTRACTION: Timely Recovery of Invested Capital – Regulatory LagHistoric Test Year Jan 1 ’08 Jan 1 ‘07 Jan 1 ‘06 Jan 1 ‘05 Jan ’03 Jan ‘ 04 New Rates Effective Sept ’05 Investment Mar ’07 New Rate Case File New Rates Effective June ’04 Investment Mar ’04 Rate Case Filed Test Year Assuming a nine month rate proceeding and a goal to stay out of a rate case for two years: The utility will earn no return of or on an investment made in June ’04 for 3 ½ years Loss of Return & Depreciation Investment • Mitigation: Prospectively relevant test years: • Future test years (eg, IL, KY, TN, NY) • Step Increase (eg, CA – 3-year rate cycle) • DSIC (IL, PA, DE, MO, IN, NY, OH, CT) • Results: • Dilutes allowed returns • Skews efficient capital invested • Forces more frequent rate cases
Negative Impact of Regulatory Lag and Potential Impact on Cost of Capital for Capital Intensive Regulated Industries “Primarily because of regulatory lag and increased financing expenses that cause balance sheet strain and execution risks, utilities suffer sub par returns during periods of heavy capital investment.” (Source: Lehman Brothers; Power and Utilities: Regulated Utilities; Global Equity Research, North America, May 22, 2007) Infrastructure Replacement Surcharge Programs Permit Utilities to Better Manage Cash Flows and Capitol Programs in Times of Extreme Financial /Market Volatility “Firms can also reallocate capital to projects with more timely return periods and take advantage of regulatory mechanisms that recover investment more quickly. Pennsylvania’s distribution system infrastructure charge (DSIC), which allows a monthly customer surcharge for pipe repair costs, is an example of this.” (Source: Janney Montgomery Scott, LLC; Water Industry Report; October 30, 2008)
Perception of Regulatory Support (Maintenance of “Regulatory Compact”) Essential to Continued Access to Capital for Water Utilities Price as a percent of base (April 23, 2008 = 100%)
NAWC Infrastructure Initiatives • Investment Tax Credits • Public Utility Dividend Reinvestment Plans • Tax Exempt Financing • Depreciation/Bonus Depreciation • State Revolving Loan Funds
Status of Stimulus Package Tax Incentives Some success on each of the following: • Bonus Depreciation Provision Extension • Alternative Minimum Tax (AMT) Exemption on Tax Exempt Bonds • State Revolving Loan Funds (SRF)