Download
1 / 6
Comparative Rarefaction Analysis of cpn60 Sequences in Two Datasets
60 likes | 157 Vues
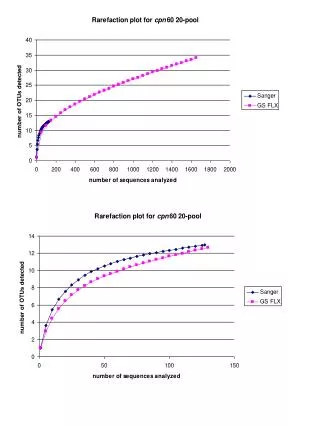
This study compares rarefaction analysis of cpn60 sequences between Sanger and GS FLX datasets for a pooled sample, followed by in-depth analysis of pyrosequencing data for individual samples. Supplementary figure S1 depicts the rarefaction curves for samples IND001, IND006, IND027, and IND054.
Télécharger la présentation 
Comparative Rarefaction Analysis of cpn60 Sequences in Two Datasets
An Image/Link below is provided (as is) to download presentation
Download Policy: Content on the Website is provided to you AS IS for your information and personal use and may not be sold / licensed / shared on other websites without getting consent from its author.
Content is provided to you AS IS for your information and personal use only.
Download presentation by click this link.
While downloading, if for some reason you are not able to download a presentation, the publisher may have deleted the file from their server.
During download, if you can't get a presentation, the file might be deleted by the publisher.
E N D
Presentation Transcript
Supplemental figure S1. Rarefaction analysis of cpn60 UT sequence data in the Sanger (diamond) and GS FLX (square) datasets for the pooled sample 1. Subsequent plots demonstrate rarefaction analysis of cpn60 pyrosequencing data for samples ind001, ind006, ind027, and ind054.
More Related