Download
1 / 12
120 likes | 309 Vues
Catch at age table: lots of work, lots of data and apparent information. A bit of history. Fry 1940s: ”virtual population”, “catch curve” Gulland 1950: VPA (virtual population analysis) Doubleday, Paloheimo 1976-79: SCA (statistical catch at age analysis)

E N D
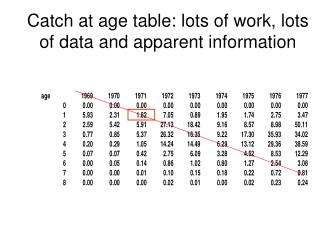
Catch at age table: lots of work, lots of data and apparent information
A bit of history • Fry 1940s: ”virtual population”, “catch curve” • Gulland 1950: VPA (virtual population analysis) • Doubleday, Paloheimo 1976-79: SCA (statistical catch at age analysis) • Deriso, Fournier 1978-1985: SCA with auxiliary information • Kimura 1982: “stock reduction analysis” • Gavaris 1979: ADAPT program for VPA • Fournier 1990: ADMB for faster SCA • Methot 1990: “stock synthesis” (SCA plus)
Parameter estimation and state reconstruction for dynamic models Observation errors Process errors Parameters Observation Model (predicted y) Data (observed y) State dynamics Model N Statistical criterion y N Nt+1=Nt-Ct yt=qNt Parameter q Log-likelihood function Parameter No
Catch at age table effects Cohort effect Age effect Year effect
And there can be so much nice data (as for Newfoundland cod)
Where do you get the Cat? • Age composition sampling (best) • Age composition by length, expansion of length frequencies using that composition (OK if good composition data at all lengths) • Age-length “key” (assign each length in length frequency data to an age) (Bad!) • Predict length composition directly (Synthesis type models only) (Very bad unless GTG accounting used for size structure)
Z=0.52 What’s the matter with good old catch curves? -Assume older ages equally vulnerable (why are there less old fish?) -Only use information in data from “fully recruited” (equally vulnerable) ages -Ignore effects of changes in recruitment (again, why are there less old fish?) -Assume same harvest impact in all past years
VPA: backward in time Na,t=Na+1,t+1/S+Ca,t Problem: how to get the U’s along the edge of the table, to set N=C/U? SCA: forward in time Na+1,t+1=Na,t(1-Uat)SCa,t=Utva,tNa,t Problem: too many parameters Two ways to parameterize catch at age models (SCA vs VPA) R1 R2 R3…………………Rn C1/U1 C2/U2 C3/U3… Cm/Um N2 N3… Nm Cn/U1 Cn/U2 Cn/U3…Cn-1/Un
Deciding between SCA and VPA • DON’T DECIDE. When you can, use both (can’t use VPA except over periods where catch at age can be estimated for every historical year) • SCA more precise and accurate when fishery has had stable, simple logistic vulnerability at age pattern (SCA predicts catch at age, so “sees” F effects in data) • But SCA can be badly biased when vulnerability schedule has changed a lot and/or is dome-shaped (F effects in catch at age data confounded with vulnerability changes) • Use VPA whenever possible to check for complex, changing vulnerability patterns
Common causes of severe biases in estimated stock size and trend • Bad abundance index data (especially hyperstable cpues) • Rapid changes in size selectivity (especially targeting small fish as stock declines, makes recruitment appear high) • Inappropriate priors for recruitment variation when recruitment “constrained” to vary around a stock-recruitment curve • Dome-shaped vulnerability (makes F look too high when ignored, and too low when estimated but estimates are confounded with effects of F or recruitment trends on proportions of older fish
But sometimes they are still very useful, as for Vaughan’s menhaden data How could Z have decreased while effort was Increasing?
Output control and age-structured assessments don’t mix well? Shelton, ICES J. Mar. Sci. (2007); note increases in F (circles) as stock size declined in range-contracting stocks. Shelton notes that scientific advice is not being consistently followed, even when that advice is not biased by assessment problems for range-contracting stocks.