Jet Fuel Hedging
Jet Fuel Hedging. Michael Balayan Alyssa Lum Paul Sestili Lana Simkina. May 3, 1999. Company Background. Continental Airlines is a major U.S. air carrier with $7.9 billion in revenues and $383 million in profits in 1998

Jet Fuel Hedging
E N D
Presentation Transcript
Jet Fuel Hedging Michael Balayan Alyssa Lum Paul Sestili Lana Simkina May 3, 1999
Company Background • Continental Airlines is a major U.S. air carrier with $7.9 billion in revenues and $383 million in profits in 1998 • Jet fuel expense is the second biggest cost item accounting for 10% of total operating costs • The company budgets its 1999 jet fuel expenses at approximately $800 million (+/- 10%) • The company is risk averse
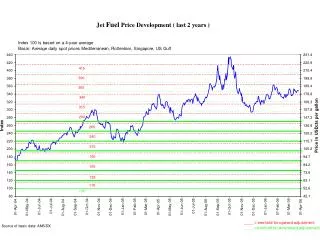
Exposure • Jet fuel prices are highly volatile, since they are “...influenced significantly by international political and economic circumstances” (Continental’s Annual Report) • The company is willing to accept a 15.87% risk of fuel expense exceeding $880 million (budget+10%) for the year (1999) • This would lead to a 1% increase in total operating expenses and at least 1% decrease in earnings (possibly a bigger drop due to decreases in demand)
Exposure • Continental uses oil-based hedging (commodity CL) to mitigate its fuel exposure because: • jet fuel-based hedging is available only OTC and is too expensive • prices for jet fuel are highly correlated with oil prices • oil is readily traded on NYMEX • Jet fuel prices move approximately $0.80 for each $1 move in oil prices • Therefore, $640 million oil exposure per annum (or $160 million per quarter) is roughly equivalent to $800 million jet fuel exposure
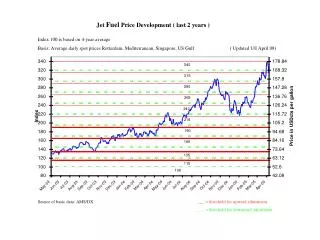
Oil Market • Analysts report global surplus of oil finally going down • OPEC’s efforts to trim supplies resulted in a 50% increase in oil prices in the last two months • However, there is significant uncertainty about sustainability of the recent high price levels • Additional uncertainty is due to a highly unstable political situation in the oil-producing regions --> fear of a sudden oil supply cut
Analysts’ Consensus • prices will go down • drop in prices will be limited • prices remain volatile • possibility of big price increase
View Limited down, concern about big up “No risk” Down, sure Down, unsure Down, less unsure relative to the previous view Down, more sure relative to forward Corresponding Position Short forward range-type position Long forwards equal $160 million Long forwards sufficient to remain within risk limits Synthetic long put Synthetic long put sufficient to remain within risk limits Long puts (opposite of Texas hedge) - trading position View Alternatives Direction View: Down Volatility View: Stable
Value at Risk Note: zero risk premium assumed, as oil prices are relatively unaffected by macroeconomic factorsand do not have systematic risk
Recommended Position: Limited Down, Worry Big Up Short Forward Range-type position (-9F+6Cotm-6Potm) Buy 6,007 Cotm and sell 6,007 Potm
Position 1: “No Risk” Fully hedged (-9F+9F) Buy 8,815 forward contracts
Position 2: Down, Sure Hedge to risk limit (-9F+5F) Buy 4,598 forward contracts
Position 3: Down, Unsure Insure with long call (-9F+9Cotm) Buy 8,815 Cotm
Position 4: Down, Less Unsure Insure with long call to risk limit (-9F+8Cotm) Buy 7,773 Cotm
Position 5a: Down, Most Sure Aggressive trading based on volatility up view (-9F+6F+8Potm) Buy 7,773 Potm and 5,950F
Position 5b: Down, Most Sure Aggressive trading based on volatility up view (-9F+4F+8Potm) Although exceeds risk limits, this position may be possible, since rate of loss increase is lower than that of the original position.
Comparative Analysis * Ranges of underlying prices with positive outcomes implies the price ranges where outcome of the recommended position exceeds the outcome of an alternative position
Recommendation • Use partial short forward range: buy 6,007 Cotm, sell 6,007 Potm • Most consistent with Continental’s direction and volatility view • At one standard deviation of underlying price ($21.94), losses are limited to $16 million - our risk limit
Recommendation • Inexpensive relative to other hedging options (give up some upside in return for income) • As the comparative analysis indicates, the recommended position yields higher outcomes in the underlying price ranges most likely to occur based on our view