Download
1 / 1
10 likes | 138 Vues
Percentages Correct Structure Identified as Best Match. Percentages Correct Structure Identified Within Top 10 Matches. Organic Molecule Identification Using 1D Proton & Carbon Spectra. Reinhard Dunkel * and Xinzi Wu, ScienceSoft LLC, Sandy, UT.

E N D
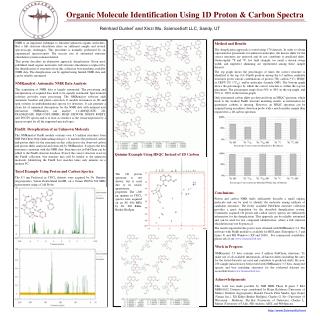
Percentages Correct Structure Identified as Best Match Percentages Correct Structure Identified Within Top 10 Matches Organic Molecule Identification Using 1D Proton & Carbon Spectra Reinhard Dunkel* and Xinzi Wu, ScienceSoft LLC, Sandy, UT NMR is an important technique to elucidate unknown organic molecules. But a full structure elucidation relies on sufficient sample and several spectroscopic techniques. This procedure is normally performed by an experienced spectroscopist. The success rate of automated structure elucidation systems remains limited. This poster describes an alternative approach: dereplication. Given most published small organic molecules, full structure elucidation is replaced by the identification of structures from this collection best matching available NMR data. The dereplication can be applied using limited NMR data and can be reliably automated. Method and Results The dereplication approach is tested using 179 datasets. In order to obtain representative placements for unknown molecules, the known shifts for the correct structures are removed and do not contribute to predicted shifts. Undecoupled 19F and 31P, low field strength, too small a chosen sweep width, and imperfect shimming are represented among these sample datasets. The top graph shows the percentages of times the correct structure is identified at the top (1st) FindIt position among the 6.3 million candidate structures given various combinations of proton (1H), carbon (13C), HSQC or DEPT-135 (13CH), and/or molecular formula (MF). The bottom graph shows the percentages by which the correct structure is within the top ten placement. The percentages range from 56% to 98% in the top graph, and 79% to 100% in the bottom graph. Only protonated carbon shifts are detected from an HSQC spectrum, which leads to the weakest FindIt structure matching results, as information for quaternary carbons is missing. However, an HSQC spectrum can be acquired using an indirect detection probe with a much smaller sample than required for a 1D carbon spectrum. NMRanalyst: Automatic NMR Data Analysis The acquisition of NMR data is largely automated. The processing and interpretation of acquired data need to be equally automated. Spectrometer software provides some processing. The NMRanalyst software adds automatic baseline and phase correction. It models resonances in 1D and spin systems in multidimensional spectra for detection. It can generate a clean list of numerical descriptions for the NMR data with minimal user interaction. NMRanalyst can analyze 1,1-ADEQUATE, 2D-INADEQUATE, DQF-COSY, HMBC, HSQC, HETCOR, NOESY, ROESY, and TOCSY spectra and is at least as sensitive as the visual inspection by a spectroscopist for all the supported spectral types. FindIt: Dereplication of an Unknown Molecule The NMRanalyst FindIt module contains over 6.3 million structures from NIH PubChem (http://nihroadmap.nih.gov). It matches the predicted carbon and proton shifts for the structures in this collection to the observed carbon and proton shifts analyzed and extracted by NMRanalyst. It reports the best structures consistent with the NMR data. Structures not in PubChem can be added to the FindIt structure database. Even if the correct structure is not in the FindIt collection, best matches may still be similar to the unknown molecule. Identifying the FindIt best matches takes only minutes on a modern PC. Quinine Example Using HSQC Instead of 1D Carbon Taxol Example Using Proton and Carbon Spectra The 8.3 mg Paclitaxel in CDCl3 datasets were acquired by Dr. Dimitris Argyropoulos, Varian Deutschland GmbH, on a Varian INOVA 500 MHz spectrometer using a Cold Probe. The 1D proton spectrum is not shown, but is used due to its nearly quantitative properties. The ~200 µg quinine in CDCl3 spectra were acquired on an AV 400 MHz by Dr. Till Kühn, Bruker BioSpin. Conclusions Proton and carbon NMR shifts sufficiently describe a small organic molecule and can be used to identify the molecule among millions of candidate structures. The freely available PubChem structure collection provides a great foundation for the described dereplication system. Commonly acquired 1D proton and carbon survey spectra are sufficiently informative for the dereplication. This approach can be reliably automated and can be used for fast compound identification, where a full structure elucidation may not be practical. The results reported in this poster were obtained with NMRanalyst 3.4. The software with FindIt module is available for RH Linux (Enterprise 4, 3 and Linux 9) and MS Windows (XP and 2000). For commercial availability, please ask or see www.ScienceSoft.net. Work in Progress NMRanalyst 3.5 beta contains over 8 million PubChem structures. To make use of all available information, all known shifts (including the ones for the tested datasets) are used and contribute to predicted shifts. By now 230 sample datasets have been tested with NMRanalyst 3.5 beta. Analyzed spectra and best matching structures for the evaluated datasets are accessible from www.ScienceSoft.net. Acknowledgements This work was made possible by NIH SBIR Phase II grant 5 R44 MH061652. Datasets were contributed by Heinz Kolshorn (University of Mainz), Dimitris Argyropoulos, Ronald Crouch, Péter Sándor, Igor Goljer (Varian, Inc.), Till Kühn (Bruker BioSpin), Charles G. Fry (University of Wisconsin - Madison), Shi Bai (University of Delaware), Charles L. Mayne (University of Utah), FID Archive, AIST, and WebSpectra. http://www.ScienceSoft.net