Download
1 / 17
170 likes | 190 Vues
Compare heights using computational formulas, IQR analysis, mean, st. dev., and % within standard deviations. Homework worksheet includes new formula for st. dev. computation. Learn more about outlier impact & normal distribution estimation.

E N D
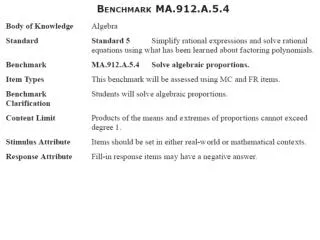
Computational Formula: This is an easier computational formula that contains no rounding.
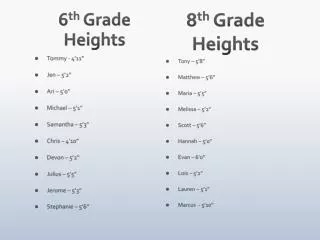
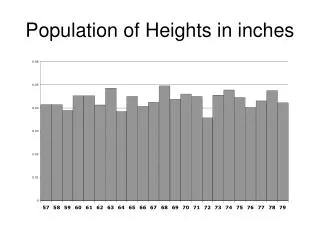
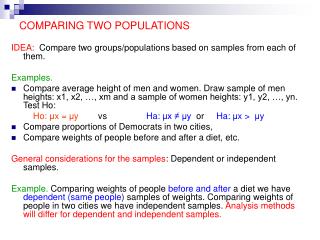
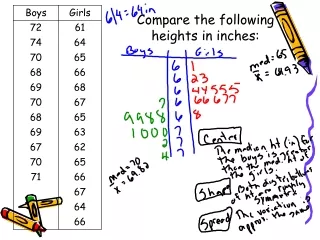
The following data represents the heights of some students in my class. • Find the mean & st. dev. • What % are within 1 st. dev. Of the mean? • What % are within 2 st. dev. Of the mean?
IQR – Interquartile Range • This is the measure of variability that is not affected by outliers. • It’s based on quartiles.
25% 25% 25% 25% - This is the median of the lower ½ of the sample. - This is the median. - This is the median of the upper ½ of the sample.
If normal distribution – then you can estimate the standard deviation with the IQR. Standard Deviation *Can also be use to check to see if a distribution is normal – if much larger then it’s skewed.
Homework • Worksheet • Use the new formula to compute the standard deviation.