Download
1 / 47
541 likes | 915 Vues
Mechanisms of Adverse Effects of Hyperglycemia in Acute Illness. A Review of the Basic Science. Potential Mechanisms of Increased Mortality/Morbidity in Acutely Ill Patients. Hyperactive inflammatory response Increased oxidative stress Impaired endothelial function

E N D
Mechanisms of Adverse Effects of Hyperglycemia in Acute Illness A Review of the Basic Science
Potential Mechanisms of IncreasedMortality/Morbidity in Acutely Ill Patients • Hyperactive inflammatory response • Increased oxidative stress • Impaired endothelial function • Increased coagulation response • Increased free fatty acids • Poor tissue perfusion • Autonomic dysfunction • Increased risk of infections or poor responseto anti-infective agents
Link Between High Blood Glucose and Poor Outcomes: Potential Mechanisms Metabolic stress response ↑Stress hormones and peptides Glucose Insulin Immune dysfunction Reactive O2 species FFA Ketones Lactate Transcription factors Infection dissemination Secondary mediators Cellular injury/apoptosisInflammationTissue damageAltered tissue/wound repairAcidosisInfarction/ischemia Prolonged hospital stayDisabilityDeath Clement S, et al. Diabetes Care. 2004;27:553-591.
Mechanisms of Acute Inflammatory Reactions Inflammation due to acute injury/disease* Blood monocyte, Tissue MØ Acute Phase Proteins IL-1 family TNF family Stromal cells: IL-6, IL-8, monocyte chemoattractant protein Neutrophil recruitment, further inflammatory cytokine release * Trauma, burns, tissue infarction, cancer, immunologicand crystal inflammation
Cytokines • Signal cells and coordinate the immune response (“hormones of the immune system”) • Can be delivered to the target cell by the systemic circulation or the local environment • Bind to high-affinity surface receptors • Can be produced by non-immune cells (fibroblasts, endothelial cells)
NF-B as an Inflammatory Regulator Barnes and Karin. N Engl J Med. 1997;336:1066-1071.
p=0.08 NF-B Activation Before and After Euglycemic or Hyperglycemic Clamp Euglycemic (90 mg/dL) and hyperglycemic clamp (180 mg/dL) in nondiabetic subjects (n=9) NF-κB in peripheral blood mononuclear cells p=0.04 Schiekofer S, et al. Diabetes. 2003;52:621-633.
NF-B Activation With Oral Glucose Dhindsa, et al. Metabolism. 2004;53:330-334.
Glucose 0,33g/Kg + variable infusion Glucose pulses (0,33g/Kg) What Is the Effect of Hyperglycemia and Insulin Deficiency on Cytokine Production? Hyperglycemic clamp at 270 mg/dL, octreotide to suppress islet hormones N=20 control subjects, 12 with IGT Intermittent IV glucose pulses every 2 h Esposito K, et al. Circulation. 2002;106:2067-2072.
Cytokines During Hyperglycemic Clamp Studies Plasma cytokine concentrations attained during hyperglycemic clamps in 12 IGT (blue) and 20 control (green) subjects IGT control Esposito K, et al. Circulation. 2002;106:2067-2072.
Cytokines During Glucose Pulse Studies Circulating cytokine levels after consecutive glucose pulses in 12 IGT subjects (blue) and 20 control subjects (green) Esposito K, et al. Circulation. 2002;106:2067-2072.
Insulin as anAnti-inflammatory Agent Dandona, et al. J Clin Endocrinol Metab. 2001;86:3257-3265.
Control Insulin Anti-inflammatory Effects of Insulin inSTEMI in Nondiabetic Patients Change in C-reactive Protein ∆ CRP (mg/L) from baseline (0–h) 7 * 6 5 * 4 3 2 1 0 –1 0 2 4 6 24 48 * P<0.05 betweengroups Time (hours) Chaudhuri A, et al. Circulation. 2004;109:849-854.
Hyperglycemia Increases Lipopolysaccharide-Induced Inflammation and Insulin Suppresses It Hagiwara S, et al. Crit Care Med. 2009;37:2223-2227.
Insulin Liver - Acute phase proteins + IL-1, TNF, IL-6 + + - glucocorticoids Serum amyloid A, CRP, C3, C4, fibrinogen, plasminogen, TPa, PAI-1, ferritin
Taken Together, These Studies Suggest: • Insulin and glucose co-modulate inflammation • Hyperglycemia is proinflammatory • Hyperinsulinemia with euglycemia isanti-inflammatory • Inability to control glucose in CREATE/ECLA and DIGAMI 2 likely explains the negative results using GIK in these two studies
Hyperglycemia and hyperinsulinemiaalso affect coagulation mechanismsthat increase mortality and morbidityduring acute illness
Hyperglycemia Stimulates Coagulationin Healthy Humans Plasma concentrations of thrombin-antithrombin complexes (TATc) (A) and soluble tissue factor (B) in 6 subjects studied during a low-insulin euglycemic clamp (□), low-insulin hyperglycemic clamp (○), hyperinsulinemic euglycemic clamp (▪), and hyperinsulinemic hyperglycemic clamp (•). * P<0.001 vs both euglycemic clamps. Stegenga, et al. Diabetes. 2006;55:1807-12.
Hyperinsulinemia Impairs Fibrinolysisin Healthy Humans Plasma concentrations of tPA antigen (A), plasminogen activator activity (PA activity) (B), PAI-1 antigen (C), and PAI-1 activity (D) during a low-insulin euglycemic clamp (□), low-insulin hyperglycemic clamp (○), hyperinsulinemic euglycemic clamp (▪), and hyperinsulinemic hyperglycemic clamp (•). * P<0.001 vs both euglycemic clamps. Stegenga, et al. Diabetes. 2006;55:1807-12.
Thus, hyperglycemia stimulatesthrombus formation and, once formed, hyperinsulinemia prevents its breakage. Therefore, it will be ideal if one could prevent hyperglycemia
And What Is the Effect of Oxidative Stress on Inpatient … • Infection? • Wound healing? • Cardiovascular and renal outcomes?
Measuring Oxidative Stress • Urinary isoprostanes: best marker of oxidative stress in total body • Urinary 8-iso-PGF2-alpha: most common isoprostane • Nitrotyrosine: marker for peroxynitrite, a powerful oxidant increased with hyperglycemia • 8-hydroxydeoxyguanosine (8-OHdG): a sensitive indicator of oxidative damage to DNA • Reactive oxygen species generation by leukocytes • “A1C of oxidative stress”
Oral Glucose Load CausesOxidative Stress Mohanty P, et al. J Clin Endocrinol Meta. 2000;85:2970-2973.
Insulin as Antioxidant Dandona, et al. J Clin Endocrinol Metab. 2001;86:3257-3265.
What Is the Effect of Insulin and Different Levels of Glycemia on Nitric Oxide Production?
An Understanding of Nitric Oxide (NO) • In endothelium, eNOS generates low levels of NO, which has protective properties • In virtually every cell type, iNOS (inducible) generates high NO concentrations, which are proinflammatory
Proposed Mechanisms for Production of Endothelium-Derived NO and Vasoconstrictors In Health In Insulin Resistance/Diabetes Rask-Madsen C, King GL. Nat Clin Pract Endocrinol Metab.2007;3:46-56.
- VEGF-induced adhesion molecules + vasodilation -inflammation Nitric Oxide (low amounts) eNOS - +
+ VEGF-induced adhesion molecules + inflammation ++ vasodilation Nitric Oxide(high amounts) iNOS + - NF-kB
Intensive Insulin Therapy in Critically Ill Patients: Blood Glucose Control, Insulin Doses, and CRP CIT IIT ** ** ** ** ** * ** ** N=405 in SICU X >7 days Blue box = CIT (N=224); gray box = IIT (N=181) Langouche L, et al. J Clin Invest. 2005;115:2277-2286.
What Data Support the RelationshipBetween eNOS, iNOS, and Insulin? • Postmortem biopsies in CIT (white boxes, N=49) and IIT (gray boxes, N=27) • NF-κB activation evaluated by analysis of phosphorylated IB Central line = the median Box height = IQR Whiskers = 10th-90th percentiles * P ≤0.05; ** P ≤0.01; § P ≤0.1 Langouche L, et al. J Clin Invest. 2005;115:2277-2286.
What Happens to Nitric Oxide WithIntensive Insulin Therapy (IIT)? Serum NO levels, in CIT (white boxes) and IIT (gray boxes) Central line = the median Box height = IQR Whiskers = 10th-90th percentiles * P ≤0.05 vs conventional insulin therapy † P ≤0.05 day 7 vs admission day # P ≤0.05 vs healthy volunteers ## P ≤0.01 vs healthy volunteers Langouche L, et al. J Clin Invest. 2005;115:2277-2286.
Nitric Oxide and Insulin: Conclusion • “Maintaining normoglycemia with intensive insulin therapy during critical illness protects the endothelium likely in part via inhibition of excessive iNOS-induced NO release, and thereby contributes to prevention of organ failure and death.” Langouche L, et al. J Clin Invest. 2005;115:2277-2286.
The Implications of Glucose Variability:Why Are Ups and Downs Bad?
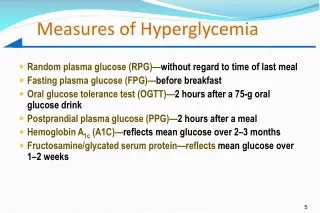
Measuring Glycemic Variability • Mean amplitude of glycemic excursions (MAGE) • Standard deviation on SMBG meter download
One Possible Mechanism • Human umbilical vein endothelial cells (HUVECs) “exposed to intermittent hyperglycemia results in ROS overproduction, through a PKC-dependent activation …” • This suggests that glucose fluctuation may be involved in the development of oxidative stress and vascular injury Quagliaro L, et al. Diabetes. 2003;52:2795-2804.
Low Glucose Low Glucose Low Glucose Low Glucose High Glucose High Glucose High Glucose High Glucose Alternating High and Low Glucose Alternating High and Low Glucose Alternating High and Low Glucose Alternating High and Low Glucose Oxidative Stress Marker Measurements C A PKCX osm con ox stress X B D Quagliaro L, et al. Diabetes. 2003;52:2795-2804.
1200 1000 800 600 400 200 0 R=0.86, p<0.0001 Urinary 8-SO-PGF2 alpha Excretion Rates (pg/mg creatinine) 0 20 40 60 80 100 120 140 160 MAGE (mg glucose/dL) Correlation Between Urinary 8-iso-PGF2 alpha and MAGE in T2DM Monnier L, et al. JAMA. 2006;295:1681-1687.
Why This Study Is So Important • Type 2 diabetes • Oxidative stress not related to A1C, fasting glucose, fasting insulin, mean blood glucose • Stronger correlation of oxidative stress to MAGE than to postprandial glucose levels • MAGE = both the ups and the downs of blood glucose Monnier L, et al. JAMA. 2006;295:1681-1687.
Glucose Fluctuations May Be Involved in the Pathogenesis of Vascular Diabetic Complications # $ • Cell death of human umbilical vein endothelial cells • “Variability in glycemic control may be more deleterious than a constant high concentration of glucose” * & * Risso A, et al. Am J Physiol Endocrinol Metab. 2001;281:E924-E930.
Glucose Fluctuations May Be Involved in the Development of Vascular Injury in Diabetes PKC activity at low glucose (5mM), high glucose (20 mM), or alternating low and high Quagliaro L, et al. Diabetes. 2003;52:2795-2804.
without PJ34 with PJ34 Effect of Normal (90), High (360) or Alternating Glucose Levels on UVHEC Adhesion Molecules and IL-6 Poly ADP ribose polymerase = inhibitor of adhesion molecule expression and inflammation Conditions Piconi L, et al. J Thromb Haemost. 2004;2:1453-1459.
Hypoglycemia Also Increases Cytokines Dostson S, et al. Diabetes Care. 2008;31:1222-1223.
So What Is the Significance of the Understanding of Glucose Variability? • “It suggests that different therapeutic strategies now in use should be evaluated for their potential to minimize glycemic excursion, as well as their ability to lower A1C.” • “Wider use of real-time continuous glucose monitoring in clinical practice would provide the required monitoring tool to minimize glycemic variability and superoxide overproduction.” Brownlee M, et al. JAMA. 2006;295:1707-1708.
Summary • Hyperglycemia is proinflammatory, pro-oxidative, and pro-coagulant • All these mechanisms are known to increase mortality and morbidity in acutely ill patients • In experimental models, correction of hyperglycemia reverses all the above abnormalities • In the presence of euglycemia, insulin may have direct anti-inflammatory, anti-oxidative, and anti-coagulant effects • In the presence of hyperglycemia, role of insulin is controversial, but it may be harmful
Summary • High free fatty acid levels that are associated with insulin resistance and hyperglycemia in acutely ill patients can further increase inflammation and cause endothelial dysfunction • Fluctuating blood glucose levels are also proinflammatory and induce endothelial dysfunction and oxidative stress • Therefore, the best way to suppress the harmful cellular and molecular mechanisms during acute illness is the maintenance of a stable glycemic control in the physiological range