Download
1 / 75
750 likes | 773 Vues
This presentation provides an assessment of the causes of haze, including aerosol descriptions, meteorological descriptions, emissions descriptions, trajectory analysis, and episode analysis. The COHA study data from 1997 to 2002 is analyzed to determine the causes of haze in various regions. The virtual report presents descriptive analyses, maps, animations, and links to external websites to help interpret the causes of haze.

E N D
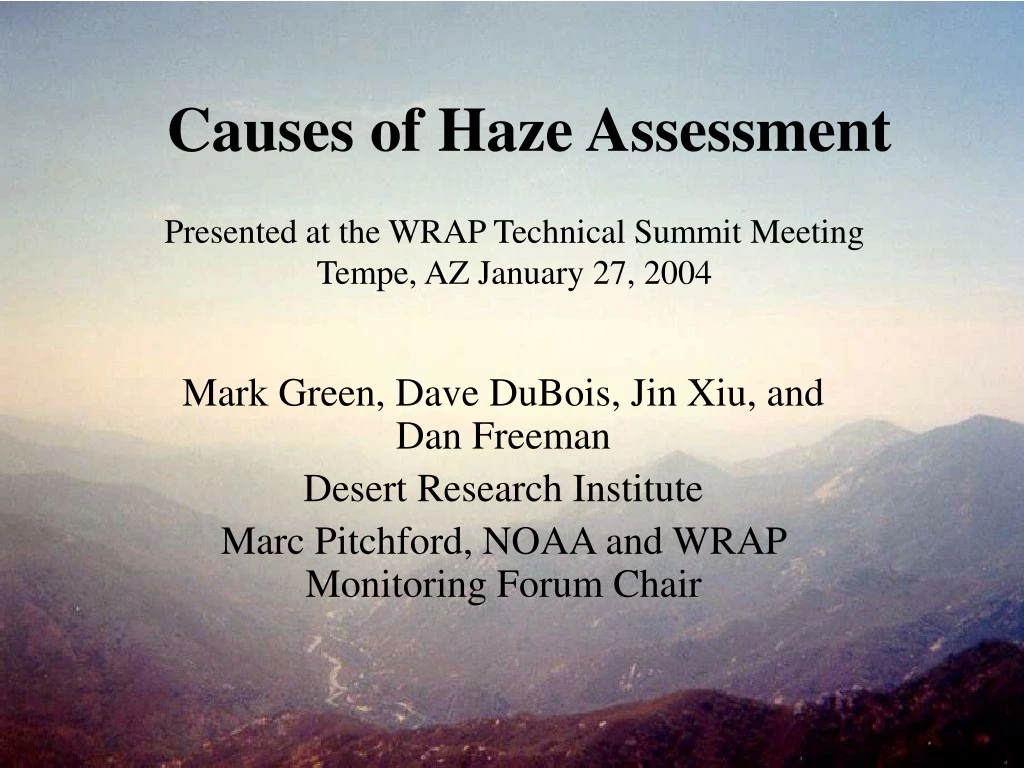
Causes of Haze Assessment Presented at the WRAP Technical Summit Meeting Tempe, AZ January 27, 2004 Mark Green, Dave DuBois, Jin Xiu, and Dan Freeman Desert Research Institute Marc Pitchford, NOAA and WRAP Monitoring Forum Chair
COHA Status Report • Review goals and objectives • COHA approach • Virtual report • Aerosol descriptions • Meteorological descriptions • Emissions descriptions • Trajectory analysis • Episode analysis 2
COHA Study Data • Began analysis of 1997 to 2002 IMPROVE and protocol database • Primarily using IMPROVE and protocol sites with full speciation data in the study region (118 sites by December 2002) • Using nationwide network of 158 sites (end of 2002) to establish continental and regional setting 4
COHA Approach Determine causes of haze at WRAP and CENRAP Class I areas, tribal and selected CENRAP IMPROVE protocol sites 5
COHA Approach • Virtual report—no paper report • A virtual report designed as a tool to: • guide us in the causes of haze • communicate results • help users to interpret causes of haze • Virtual report gives us the ability to mix text, graphics, animations and links to external web sites in addition to timely updates 7
Not just computing statistics, but forming conclusions regarding the causes of the haze • First complete a set of descriptive analyses, maps, and other graphics for aerosol composition, spatial and temporal variation, emissions, land use, topographic effects, transport patterns, local wind patterns etc • Do episode analyses to determine likely causes of haze for various commonly and uncommonly occurring conditions • Using above resources form conceptual models of causes of haze and assign quantitative number based on frequency of occurrence of conditions
Causes of Haze likely to be segregated by compound of interest, e.g. sulfate and by geographic area- by source type as possible • Example- Sulfate causes 50% of aerosol haze at Area A- 60% of which is generated within the WRAP area, mainly in the states of B,C,D , 20% is transported into the RPO from states to the east of WRAP and mainly in summer, and 20% from other countries (mostly Country F). Based upon emissions inventory, it is estimated that 80% of the sulfate haze is due to source type G. • Nitrate is X % of the haze, 50% of which…….. • Carbon, coarse mass- probably more difficult
The Causes of Haze web site is online now in a DRAFT, password protected form: http://coha.dri.edu Username: dri-coha Password: hazeyweb Much of the web site is a shell ready to receive data and causes of haze information that we generate 8
This interface is under construction and may change View reports by state, area, tribal area or protocol site View animations of IMPROVE measurements 9
Aerosol Descriptive Analysis Provides answers to the questions: • For the years 1997-2002, how many measurements are available for the site in each month of each year, and what are the contributions of the major aerosol components to light extinction in each month of each year? • What is the overall average light extinction at the site, and what are the contributions of the major aerosol components to the light extinction? • What are the light extinction contributions by the major aerosol components for best, worst and average days and how do they compare? • What percentage of the sampling days are the worst days in each month & how variable are the chemical components? 10
Aerosol Descriptive Analysis Pages designed for users to copy and paste text and figures into their own reports Example: Upper Buffalo Wilderness Area, Arkansas Both charts and text to describe the 20% best, worst and middle 60% Printer friendly and black & white versions of pages 12
% of sample days each month in worst 20 percentile Aerosol components responsible for haze worst days, by month
Sample Aerosol Description Page Overall average light extinction and contributions of major aerosol chemical components to light extinction Average contributions of major aerosol chemical components to light extinction in 20% best, middle 60% and 20% worst days Percentage of sampling days that are 20% worst days in each month Average contributions of major aerosol chemical components to light extinction during 20% worst days in each month Graphs in this page have both color and B&W versions, and links to the data table associated with it. Click on the bars in the bar chart will bring up pie charts with percentage numbers. Click on the text or numbers with hyperlinks will bring up the explanation page or associated data table or graph. It also includes links to a color and a B&W print-friendly page.
Sample Links From the Main Page Light extinction of the major chemical components in each month from 1997-2002 Mean percentage contributions of the major chemical components to aerosol light extinction in 20% worst, middle 60% and 20% best days Percentage contributions of the major chemical components to haze in 20% worst, middle 60% and 20% best days in each month of the year
Meteorological & Emissions Descriptive Analysis • Archived monitoring network locations, climate, emissions, wildfires, census, political, physical, and image databases • Information from these databases are helping us build conceptual models and answer descriptive analysis questions by visualizing data (e.g. map emissions densities) • Assist us in the general and detailed description of the meteorological setting of each site • Creating maps of emissions surrounding each site at two scales: 2 km and 20 km- Regional emission maps to be added • Include table of surrounding point sources ranked by distance and emission rate 13
Meteorological description of sites • Describe regional and local scale settings • Terrain maps and discussion • Representativeness of site • Nearby population /industrial centers • Nearby AQ/met sites • Wind patterns surface and upper air • Stability/mixing • Meteorological factors regarding AQ Big Bend NP annual wind rose
Representativeness • ZION1 monitoring site is close to the Interstate 15 corridor. • Canyons of Zion National Park are generally steep and constricted, hence susceptible to trapping inversions. In these situations, ZION1 measurements will be more representative of the Kolob Canyon section of the Park than of the Zion Canyon section, being influenced more by trapped pollutants in the basins and valleys in the New Harmony and Cedar City areas. • During large scale inversions, such as subsidence inversions associated with buildup and stagnation of synoptic high-pressure ridges over periods of a few days or longer, conditions may be more uniform within the Park. These are most likely to occur during the summer (July – September), when pressure and temperature gradients in the region are weakest, and wind circulations therefore weaker.
Wind Patterns December April August Wind roses from the Cedar City NWS site (~ 30 km north of the monitoring site) show the preponderance of southerly flow, especially in the summer, with significant frequencies of northerly wind directions in other seasons.
Zion National Park (ZION1)(Based on aerosol data from March 2000 to December 2002) On average, sulfate is the largest aerosol contributor to haze. Nitrate is the largest contributor to aerosol light extinction in the 20% worst days, with a contribution of 26%. Sulfate, OMC and CM each contributes about 20% to the aerosol light extinction in the 20% worst days.
Aerosol Properties 1. Higher occurrence of the 20% worst days happened in the summer and winter. 2. OMC is the largest aerosol contributor to haze in the 20% worst days in the summer. 3. Nitrate is the largest aerosol contributor in the winter, with a contribution of 35 - 45% in the worst days. 4. CM contributes about 20% - 25% to haze from April to September. 5. The contribution of sulfate is pretty constant throughout the year.
Trajectory Analysis Status • Three years (2000-2002), three heights (10, 500, 1500m), every three hours, 8 days back • HYSPLIT v4.6 model calculations done for all sites • Trajectory output processed and stored in database • Trajectory tool developed to produce ASCII summary files and convert trajectories into shape files • Generate summary maps • Generate monthly and annual residence time maps, 20% best, 20% worst extinction, conditional probability • Finalizing process to generate all maps, all sites in one batch- should be done late Febrruary 20
Episode Analysis • Use combination of backtrajectory, synoptic, mesoscale meteorological analysis, aerosol and emissions data to conceptually understand single site and regional or sub-regional episodes of high aerosol component concentrations • Systematic survey of episodes from the 1997 to 2002 IMPROVE database 23
Episode Analysis • Created animated maps of IMPROVE and protocol measurements for entire network • Choose episodes based on sites classified with 20% worst light extinction • Note duration, frequency, regional extent, season and components that contributed to light extinction • Assemble case studies and classify into episode types • Create database of these episodes • Combine results of episode analysis with other analyses to develop conceptual models 24
“Hazagon” Analysis • The hazagon provides a way to visualize speciated extinction for those sites in the 20% worst category 25
Example Episodes • Intermountain West Nitrate • Central US nitrate December 2002 • April 16, 2001 Asian Dust over Western US • August 2001 wildfires • October 16, 2001 Arizona dust • September 3, 1997 Eastern sulfate transport to Colorado Plateau 27
GOES View of the Dust Streak Across North America, April 17 GOES10 view of dust streak on the morning of April 17 GOES8 view of dust streak on the evening of April 17 29
Transport of the Asian dust to the United States The common weather conditions are usually associated with the upper low pressure trough / cut-ff low and surface low pressure system (low formed by a strong cyclonic vortex) over northeast China and north Korea [Kim et al., 2002]. Under this weather conditions, Asian dust can move fast along the zonal wind distribution due to the jet streak [Kim et al., 2002]. 30
Large Area Regional Haze on April 16, 2001 • 45 of the 68 WRAP IMPROVE monitoring sites were in 20% worst case days of the year 2001. For the sites that were 20% worst case days, the average contribution of fine soil to PM2.5 is ~60% (with a standard deviation of 13%), and dusts (fine soil and coarse mass) contributed in average ~ 46% (S.D. 13%) to the aerosol light extinction. • The average contribution of fine soil to PM2.5 is ~54%, and to aerosol light extinction is ~41% for all WRAP sites on April 16, 2001. 31
Asian Dust Signature • Asian dust may cause haze in a large area and last several days depending on the regional and local weather conditions in the United States. • Usually, dust elements dominate the aerosol light extinction in the whole western United States during the Asian dust episode. The dust cloud may also move to the Eastern U.S. and influence some of the eastern sites, although the influence is usually much smaller in both spatial scale and loading. • Most of the Asian dust episodes happen in the spring during the Month of March to May. 32
Asian Source Attribution Evidence • The desert regions in Mongolia and China, especially Gobi desert in Northwest China, are important sources of mineral aerosols. Given suitable weather conditions, dust can be lifted from the dry surface of the Asian Gobi desert region and transported to the United States in about 7-10 days. Extremely high aerosol loadings dominated by dust components are observed in Northern China and Korea during the episode. 33