Download
1 / 12
130 likes | 200 Vues
Extract geographical features and crime data to analyze Boston crime patterns. Utilize Python for Machine Learning to visualize city data and predict dangerous areas. Explore building footprints and crime locations to enhance safety measures.

E N D
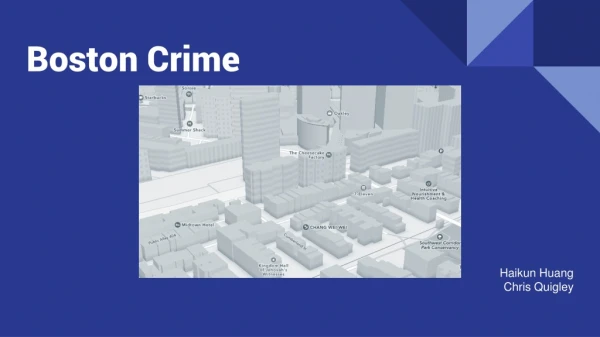
Boston Crime Haikun Huang Chris Quigley
Boston Crime • Engineering (Unity) • Extract the geographical features • Pre-compute visual elements • Machine Learning (Python)
Engineering • Scan and download the building footprints (outline) data from OSM http://www.openstreetmap.org
Engineering • Node sets of buildings, this data set represents the footprints of buildings. 180000+ buildings. • Crime Data
Engineering • Extracting the features surrounding the given crime location. # of buildings those within 100m. # of buildings those can see the crime directly. # of the same type of crimes within 100m. And average height of buildings, average distance from buildings which can see the crime directly,
Machine Learning Using the same data, we caneasily visualize the city as a 2D scatter plot. Blue points representvertices on buildings, while reddots represent crime locations.
Machine Learning The map has too many points to bevisualized at once, so instead the map isbroken up into 10,000 cells, which form a100x100 grid. Each grid cell can then betreated as an exemplar for the training set.To do this, we can extract features, such as:- The number buildings in the area- The density of the building vertices in the area- The number of crimes in the area
Machine Learning This allows us to visualize the city ina different way. For example, if we usetwo features, density and vertex count,we can plot them in 3D, where theZ-value is equal to the number of crimesin that area.In other words:The higher the point is on the Z-axis, the more crime there is.And we can assume this is because of the X and Y parameters.
Machine Learning Intuitively, one might say that an areawith more crimes is more dangerous.An arbitrary minimum number canbe chosen as a threshold, whichwill act as the decision boundary. For example:In this image, the decision boundary is located at Z = 350.Points meeting or exceeding this threshold are in red.
Machine Learning We can use linear regression and thegradient descent to try to optimize themodel’s ability to correctly identify aregion as “dangerous” or not.Using the features mentioned we canmake this decision if:0.011+ 0.147a + 0.199b > 0.230Where a is the vertex count, and b is the density, bothscaled to a range of [0, 1].Accuracy: 98.7%
Machine Learning The same concepts work with more than two parameters, but it becomes harderto visualize. Some of these features were mentioned during the engineering portion of this presentation: • Number of buildings within 100m of crimes • Number of buildings that can directly see crimes • Number of the same type of crimes reported within 100m of one another