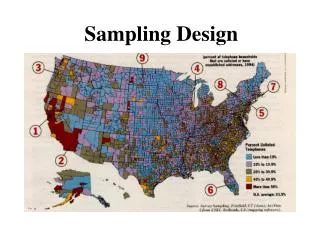
Sampling Design
Learn about sampling terminology, techniques, and sample size calculations. Explore probability and nonprobability sampling methods, their advantages, and differences. Understand how to choose the appropriate sample design based on accuracy requirements, resources, and time constraints.


Sampling Design
E N D
Presentation Transcript
Sampling Terminology • Sample • A subset, or some part, of a larger population • Population or universe • Any complete group of entities that share some common set of characteristics • Population element • An individual member of a population • Census • An investigation of ALL the individual elements that make up a population
Why Sample? • Sampling • Cuts costs • Reduces labor requirements • Gathers vital information quickly • Most properly selected samples give sufficiently accurate results
Target Population • Relevant population • Operationally define • All women still capable of bearing children vs. • All women between the ages of 12 and 50 • Comic book reader? • Does this include children under 6 years of age who do not actually read the words?
Sampling Frame • A list of elements from which the sample may be drawn • A.K.A., the working population • Mailing lists - data base marketers • Sampling services or list brokers • Sampling frame error • Error that occurs when certain sample elements are excluded from or overrepresented in a sampling frame
Two Major Categories of Sampling • Probability sampling • Known, nonzero, & equal probability of selection for every population element • Nonprobability sampling • Probability of selecting any particular member is unknown
Nonprobability Sampling • Convenience • Judgment • Quota • Snowball
Convenience Sampling • Also called haphazard or accidental sampling • The sampling procedure of obtaining the people or units that are most conveniently available
Judgment Sampling • Also called purposive sampling • An experienced individual selects the sample based on his or her judgment about some appropriate characteristics required of the sample member
Quota Sampling • Ensures that the various subgroups in a population are represented on pertinent sample characteristics to the exact extent that the investigators desire • It should not be confused with stratified sampling.
Snowball Sampling • A variety of procedures • Initial respondents are selected by probability methods • Additional respondents are obtained from information (or referrals) provided by the initial respondents
Figure 12.8 Probability Sampling Techniques Most Commonly-Used Probability Sampling Techniques Probability Sampling Techniques Simple Random Sampling Systematic Sampling Stratified Sampling
Simple Random Sampling • A sampling procedure that ensures that each element in the population will have an equal chance of being included in the sample
Systematic Sampling • A simple process • Every nth name from the list will be drawn • Periodicity • Problem that occurs in systematic sampling when the original list has a systematic pattern (I.e., the original list is not random in character)
Stratified Sampling • Probability sample • Subsamples are drawn within different strata using simple random sampling • Each stratum is more or less equal on some characteristic • Do not confuse with quota sample
What is the Appropriate Sample Design? • Degree of accuracy • Resources • Time • Advanced knowledge of the population • National versus local • Need for statistical analysis
Internet Samples • Recruited Ad Hoc Samples • Opt-in Lists
Information Needed to Determine Sample Size • Variance (standard deviation) • Get from pilot study or rule of thumb (managerial judgment) • Magnitude of error • Managerial judgment or calculation • Confidence level • Managerial judgment
Sample Size Formula - Example Suppose a survey researcher is studying expenditures on lipstick Wishes to have a 95 percent confident level (Z) and Range of error (E) of less than $2.00. The estimate of the standard deviation is $29.00.
Sample Size Formula - Example Suppose, in the same example as the one before, the range of error (E) is acceptable at $4.00 (rather than the original $2.00), sample size is reduced.
2 2 é ù é ù ( 2 . 57 )( 29 ) ( 2 . 57 )( 29 ) = = n n ê ú ê ú 4 2 ë û ë û 2 2 é ù é ù 74 . 53 74 . 53 = = ê ú ê ú 4 2 ë û ë û ] [ [ ] 2 2 = = 6325 18 . 37 . 265 = = 347 1389 Calculating Sample Size 99% Confidence
2 z pq = n 2 E Where: n = Number of items in samples Z2 = The square of the confidence interval in standard error units. p = Estimated proportion of success q = (1-p) or estimated the proportion of failures E2 = The square of the maximum allowance for error between the true proportion and sample proportion or zsp squared.
Sample Size for a Proportion:Example • A researcher believes that a simple random sample will show that 60 percent of a population (p = .6) recognizes the name of an automobile dealership. • Note that 40% of the population would not recognize the dealership’s name (q = .4) • The researcher wants to estimate with 95% confidence (Z = 1.96) that the allowance for sampling error is not greater than 3.5 percentage points (E = 0.035)
= p . 6 2 ( 96 )(. 1. ) (. 6 4 ) = n = ( . 035 ) 2 q . 4 ( 3 . 8416 )(. 24 ) = 001225 . 922 = . 001225 = 753 Calculating Sample Size at the 95% Confidence Level