Download
1 / 25
250 likes | 360 Vues
Food Poverty and Human rights. Dr Maurice Mullard. Food Costs as Percentage of Average Incomes. OECD Area approx 15 per cent UK inflation rate at 5 per cent yet some food items have been rising at 35 – 100 per cent – cereals and rice Poor Countries food around 60 per cent of average incomes

E N D
Food Poverty and Human rights Dr Maurice Mullard
Food Costs as Percentage of Average Incomes • OECD Area approx 15 per cent UK inflation rate at 5 per cent yet some food items have been rising at 35 – 100 per cent – cereals and rice • Poor Countries food around 60 per cent of average incomes • Economics of food are higher food prices good for farmers?
Agriculture in Africa • 80 per cent of people are farmers living on less than 2 dollars per day • EU 80 per cent self sufficient in food • EU and US subsidies to agriculture failure in Africa to invest in agriculture spillover effect of cheap food imports • Restriction on food exports • Higher food prices and the price of oil
Agriculture in Nigeria and Ethiopia • Both Countries emerge as democracy after military rule • All farmers are small farmers subsistence rather than agro business • Farmers receive subsidies for fertilizers • Lack of infrastructure roads technology • Ethiopia great potential for growing food for export but too poor to develop • Saudi Arabia buying tracts of lands for agriculture • Will this benefit Ethiopia?
Economics of Food • Agriculture future markets • Bring marginal land into food production • Higher food prices pay farmers more • China and India changing diets • Can we afford to carry on eating meat • Role of super markets
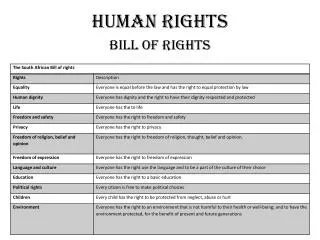
Food and Affluence • Packaging and waste • Food and shelter as human rights • The Millenium Development Goals • PRSPs
The Forgotten Billion • World population 6 billion • 800 million affluent consumers • 2.2 billion 2 and 1 dollar a day • 1 billion live in 59 countries Collier thesis on Good Governance • Rising prices of raw materials oil iron ore lack of transparency in government contracts
Ethiopia is land of contrast. • She is the second most populous country in Sub-Saharan Africa with a population of 67 million. • Nigeria is the biggest country 25 per cent of population of Africa live in Nigeria approx 140 million • Both countries have long history, mosaic (mixture) of peoples and diverse cultures. Muslim and ChrsitainSharia Law
Con’t • potential for development-agriculture, biodiversity, water resources, minerals, Yet, Ethiopia is faced with structural poverty population below the poverty line is 44 per cent. Thus, Agricultural Development Led Industrialization (ADLI) strategy is among the main Development Policies.
Ethiopia began the liberalization process in the 1990s with a clear vision of reversing the socio- economic crisis of the 1970s and 1980s and rapidly transforming the economy. Following the collapse of the military regime and its command economic system, the country has taken a major policy shift towards democracy and market-oriented economy.
2. growth rate in Macroeconomic Indicators as of (2004/05) Real GDP-------------------------------------10.6 Overall Inflation at Country level --------6.8 Private consumption Expenditure--------23.1 Gross Domestic Investment ---------------15.5 Domestic Revenue --------------------------12.0 O/W: Tax Revenue -------------------------13.7 Total Public Expenditure -------------------20.9 O/W: Recurrent ------------------------------10.5
Cont’t O/W: Capital ----------------------------------37.1 O/W:Spending on Poverty-oriented Sectors---------------------------------------------------37.6 Export of Goods & Non-factor Services (Nominal)--------------------------------------34.2 Imports of Goods & Non-factor Services (Nominal)---------------------------------- 33.3 Official Exchange Rate (Birr/USD)------ 8.65
Cont’t Sectoral distribution of GDP 2004/05 • Agriculture ---------------------------------48% • Industry ------------------------------------13% • Services-------------------------------------39%
Cont’t Structure of Export 2004/05 • Coffee--------------------------------------41% • Oil seed------------------------------------13% • Leather and Leather products ----------8% • Chat----------------------------------------12% • Gold----------------------------------------6% • Others--------------------------------------16%
Cont’t • As the result, the incidence of poverty in Ethiopia remains high with 47% and 33% of the rural and urban population respectively falling below the poverty line. • As the consequence of the structure of the economy, the problem of food insecurity. • Inadequate availability and accessibility of social services
Cont’t • Weak institutional capacity is also the problem. Because there is non-existence and/or extreme weakness of the markets especially factor markets. • The major constraint to building the productive capacity of the Ethiopian economy is also lack of adequate finance.
Con’t • Because the level of investment in Ethiopia is still very low as compared to other African countries, which had average investment to GDP of 22-25 percent.
Cont’t • Limited participation of the private sector in Ethiopia. This is because private enterprises in Ethiopia are still in the rudimentary stage of development because of structural problems. • Low contribution of export to GDP. This is because the domain of merchandise trade comes from agriculture and concentrated on single product i.e. coffee.
Con’t • Market access and managing commodity market instability i.e. volatility and declining price in commodity market.
Cont’t • The magnitude and burden of external resource leakage in the form of deteriorating ToT, debt servicing and other international payments is reaching beyond the country’s capacity.
4.The main future directions that also pursued over the last three years include: The following, among others: • Concentration on agriculture and rural development as it is a source of livelihood for 85% of Ethiopians – with a focus on agricultural research and extension, irrigation, water harvesting, and water management;
Cont’t • Encouraging private sector to promote off-farm employment; and promoting rapid export growth; • A big investment in the social sectors such as education, health, and water and sanitation;
Con’t • Deepening decentralization and empowerment, to bring decision-making closer to the grass roots population; • Improvement in governance to empower the poor, a stable framework for private sector growth;
Con’t • Launching a food security program, to improve the food security situation of the most vulnerable, and reduce dependence on emergency foreign relief aid; and, • A big effort to build capacity, in the public and private sectors, including reforming the civil service to deliver better services, strengthening the justice system, and doubling the size of the technical and vocational training, and university education systems.
Cont’t In general the four broad pillars of the Government’s strategy are: • (i) the strategy of Agricultural Development Led Industrialization Strategy; • (ii) reform of the civil service and justice system; • (iii) decentralization and empowerment; and • (iv) capacity Building