Key Press Detection Based on Accelerometer Information
Explore the potential security risks of using phone accelerometers for key press detection. Findings, methodology, conclusions, and future work discussed. Initial results show promising data analysis methods.

Key Press Detection Based on Accelerometer Information
E N D
Presentation Transcript
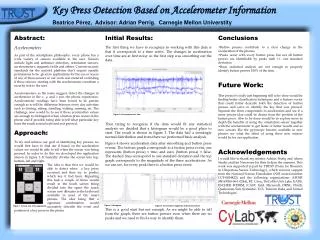
Key Press Detection Based on Accelerometer Information Beatrice Pérez, Advisor: Adrian Perrig. Carnegie Mellon Universtity Abstract: Accelerometers As part of the smartphone philosophy, every phone has a wide variety of sensors available to the user. Sensors include light and ambience detection, orientation sensors, accelerometers, magnetic fields and others. Current security standards for the android platform don’t require specific permissions to be given to applications for the use or access of any of these sensors so our work was centered on finding if these sensors, starting with the accelerometer constitute a security risk to the user. Accelerometers, as the name suggest, detect the changes in acceleration in the x, y, and z axis the phone experiences. Accelerometer readings have been found to be precise enough as to tell the difference between every day activities such as driving, sitting, standing, waking, running, etc. The challenge now would be to see if these acceleration values are enough to distinguish when a button press occurs in the phone and if possible being able to tell what particular key from the touch screen keyboard was pressed. Approach: To try and achieve our goal of identifying key presses we would first have to find out if based on the acceleration values we would be able to tell when the screen was being pressed. In order to do this we developed the application shown in figure 1. It basically divides the screen into top, bottom, left and right. The idea is that first we would be able to detect when a key press occurred and then try to predict which key it had been. Repeating this task a couple of times would result in the touch screen being divided into the space the touch screen now allocates to the keyboard available in most of the smart phones. The idea being that a signature combination would accurately describe the event and position of a key press in the phone. • Conclusions • Button presses contribute to a clear change in the acceleration of the phones. • Peaks occur with every button press but not all button presses are identifiable by peaks with +/- one standard deviation. • Basic statistical analysis are not enough to properly identify button presses 100% of the time. • Future Work: • This project is really just beginning still to be done would be finding better classification techniques and a feature vector that could better describe both the detection of button presses and serve to identify the key that was pressed. Separate the three components in acceleration and see if a more precise idea could be drawn from the position of the button press. Also to be done would be to explore more in depth the benefits of using the orientation sensor together with the accelerometer to get faster or better results and as new sensors like the gyroscope become available in new phones see what the effect of using these new sensors would be for our application. • Acknowledgements • I would like to thank my mentor Adrian Perrig and AhrenStuder and Jim Newsome for their help in the summer. This work was supported in part by TRUST (Team for Research in Ubiquitous Secure Technology), which receives support from the National Science Foundation (NSF award number CCF-0424422) and the following organizations: AFOSR (#FA9550-06-1-0244), BT, Cisco, DoCoMo USA Labs, EADS, ESCHER, HP,IBM, iCAST, Intel, Microsoft, ORNL, Pirelli, Qualcomm, Sun, Symantec, TCS, Telecom Italia, and United Technologies. Initial Results: The first thing we have to recognize in working with this data is that it corresponds to a time series. The changes in acceleration over time are at first noisy so the first step was smoothing out the data. Then trying to recognize if the data would fit any statistical analysis we decided that a histogram would be a good place to start. The result is shown in figure 3. The data had a seemingly normal distribution and from there we performed basic analysis. Figure 4 shows acceleration data after smoothing and button press events. The bottom graph corresponds to a button press event, one represents (button press) = true; and zero, (button press) = false. The dashed lines correspond to one standard deviation and the top graph corresponds to the magnitude of the three accelerations. As we can see, for every peak there is a button press event. This is a good start but not enough. As we might be able to tell from the graph, there are button presses even when there are no peaks and we need to find a way to identify them. Figure 2. Acceleration over time Figure 3. Histogram Figure 4. Acceleration magnitude and button presses Figure 1. Screen shot of the application